I don’t think I could possibly write an article like this one without acknowledging the simply amazing 2022 performance of “Big Blue”, International Business Machines (IBM). First, I want to tell it like it is. IBM has been one of the worst performing Dow components over the past decade. That’s what makes its 2022 performance so crazy. Of the 30 Dow Jones component stocks, IBM ranks in the Top 5 based on 1-week, 1-month, 3-month, and 6-month performance. It’s been trending higher recently after testing key earnings-related gap support:
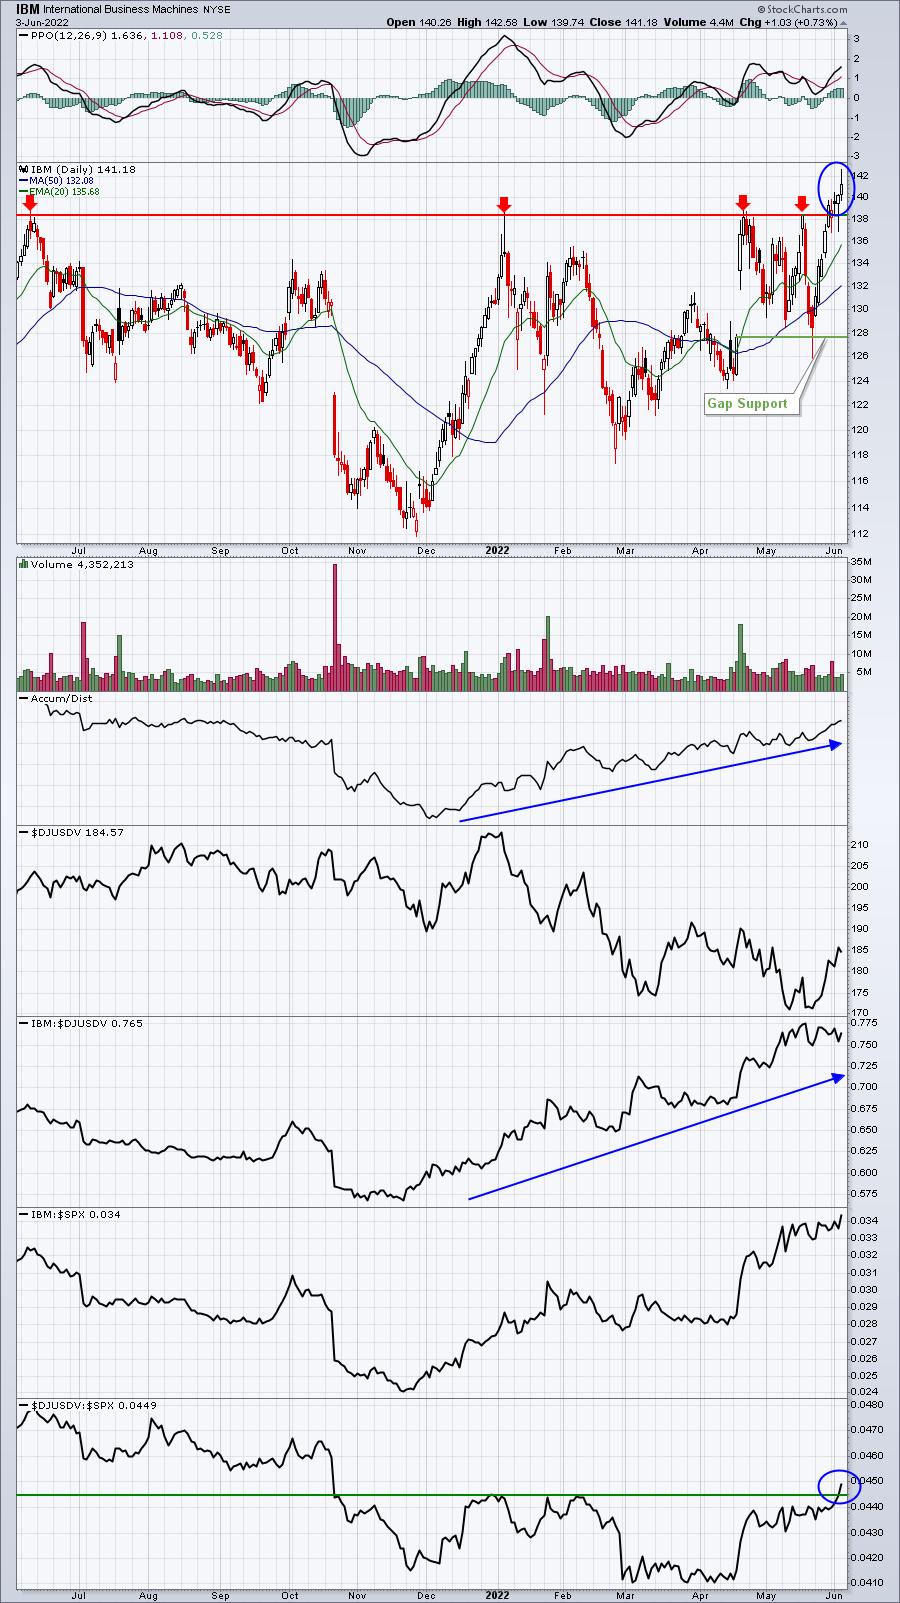
The bottom panel shows that IBM’s industry group, computer services ($DJUSDV) is finally strengthening and trending higher. Last week, it broke out to a fresh 7+ month relative high. But the more surprising chart might be its 10-year weekly chart, which shows that the 140-145 price resistance level has proven to be surprisingly difficult, especially considering how well that the S&P 500 has performed over the same period:
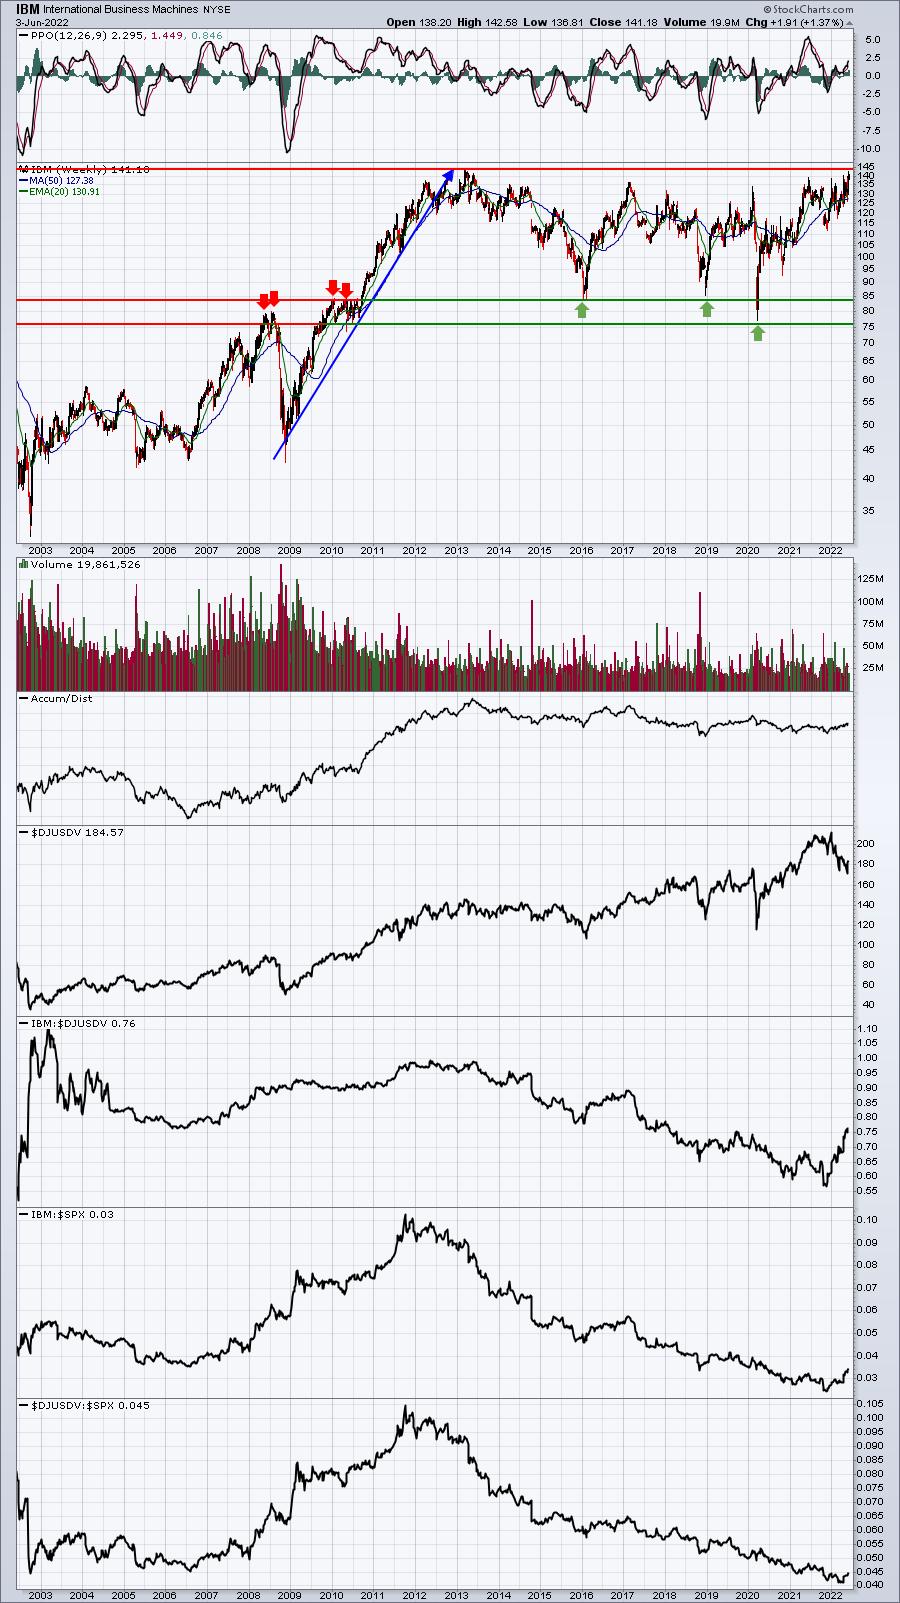
Just keep one thing in mind. A close on IBM above 145 would be a very BIG deal. The struggle at this price level dates back several years and IBM has not been able to negotiate it.
The second chart that I have found surprising for several quarters resides in the same space as IBM – in the computer services industry. It’s Zoom Video Communications (ZM). There is absolutely no question that ZM benefited from the pandemic and its brand is now much more recognized and powerful than it was two years ago. Despite all of that pandemic-related business that was generated and the cash on its balance sheet as a result, ZM recently traded LOWER than it did prior to the pandemic. Check this out:
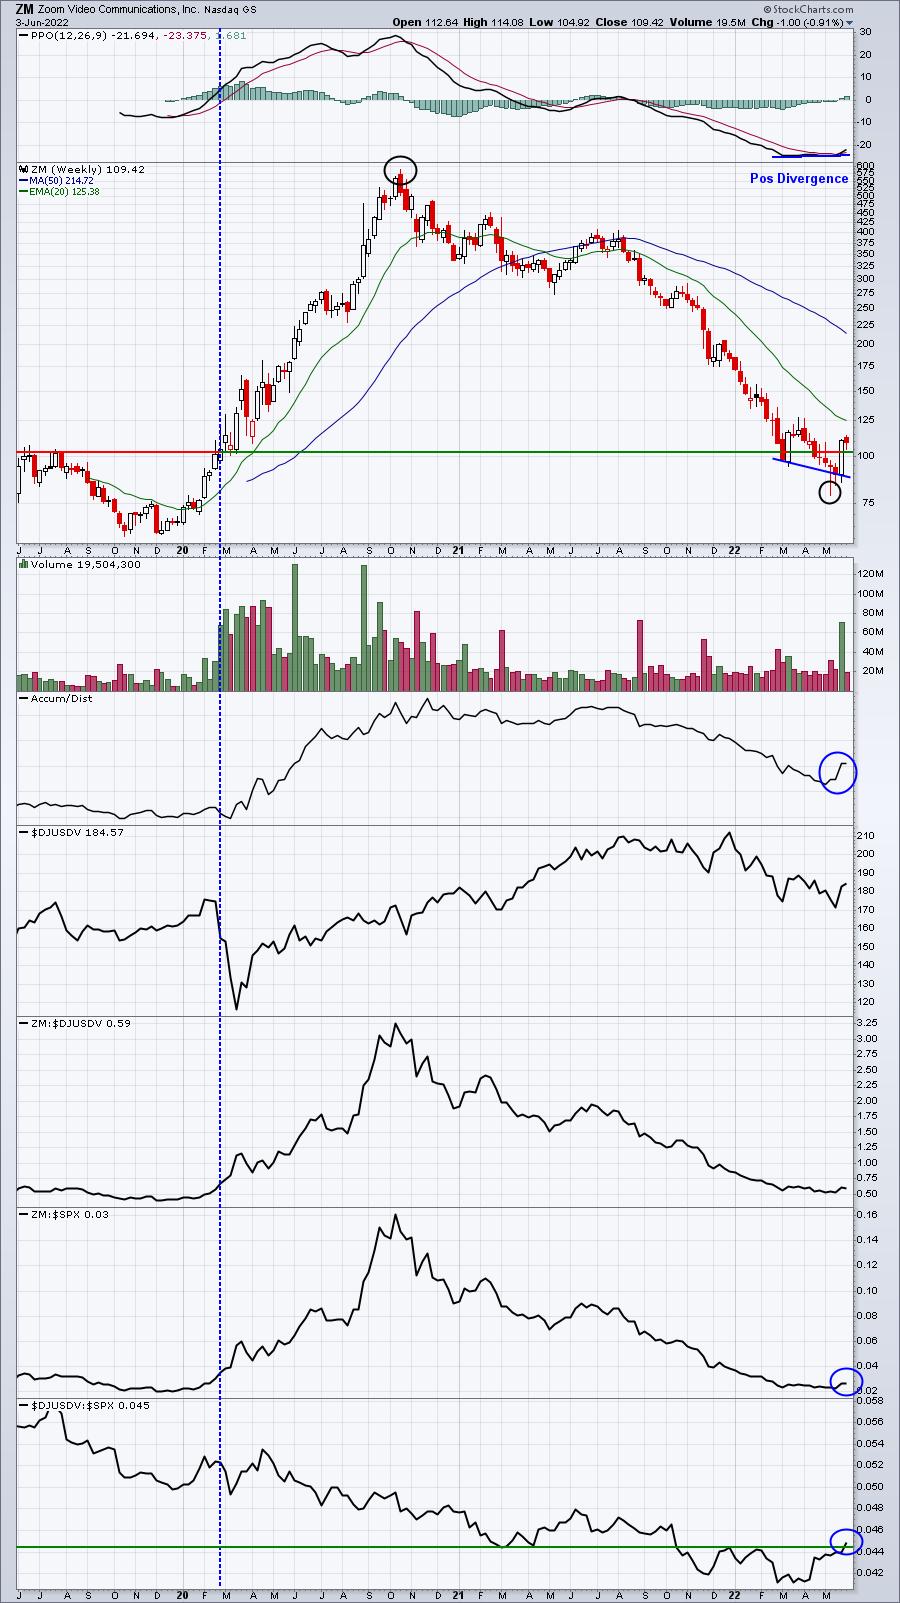
The blue-dotted vertical line marks the start (roughly) of the 2020 pandemic. ZM traded near 100 at that time. Just 2-3 weeks ago, ZM completed a 20-month decline that saw ZM fall from near 600 to 79. While we can probably all agree that ZM didn’t deserve a valuation of almost 600, we should also be able to agree that trimming the stock back to 79 was a bit crazy too! I believe ZM has bottomed. Its PPO is now back above the zero line and is as strong as it’s been for 11 months. Volume also accompanied the latest price push higher as ZM now trades back above both its 20-day EMA and 50-day SMA for the first time since it briefly did so in November 2021. Finally, ZM’s AD line has jumped to its highest level since February and its trading above its rising 20-day EMA. ZM appears to be under accumulation once again AND trending higher. That makes it a stock worth watching.
On Monday, I plan to write about the most surprising industry group chart RIGHT NOW. To receive it, simply CLICK HERE to sign up for our EB Digest newsletter, which is free (no credit card required) and is published 3x per week – Monday, Wednesday, and Friday.
Happy trading!
Tom