 The S&P 500 SPDR (SPY) is in a long-term downtrend and the Composite Breadth Model at TrendInvestorPro is bearish. A bearish Market Regime is a dangerous combination for stocks. The S&P 500 is the most important benchmark for US stocks, while the Composite Breadth Model measures market internals. This is important information because it means bearish outcomes are more likely for stocks and stock-based ETFs. In other words, the bulls face a stiff headwind.
The chart below shows SPY in a downtrend overall and the Trend Composite is negative. The red lines mark a falling channel with lower lows and lower highs, which is the most basic definition for a downtrend. The indicator window shows the Trend Composite with a whipsaw in late May and early April, but turning negative on April 18th. This indicator is one of 11 in the TIP Indicator Edge Plugin for StockCharts ACP.
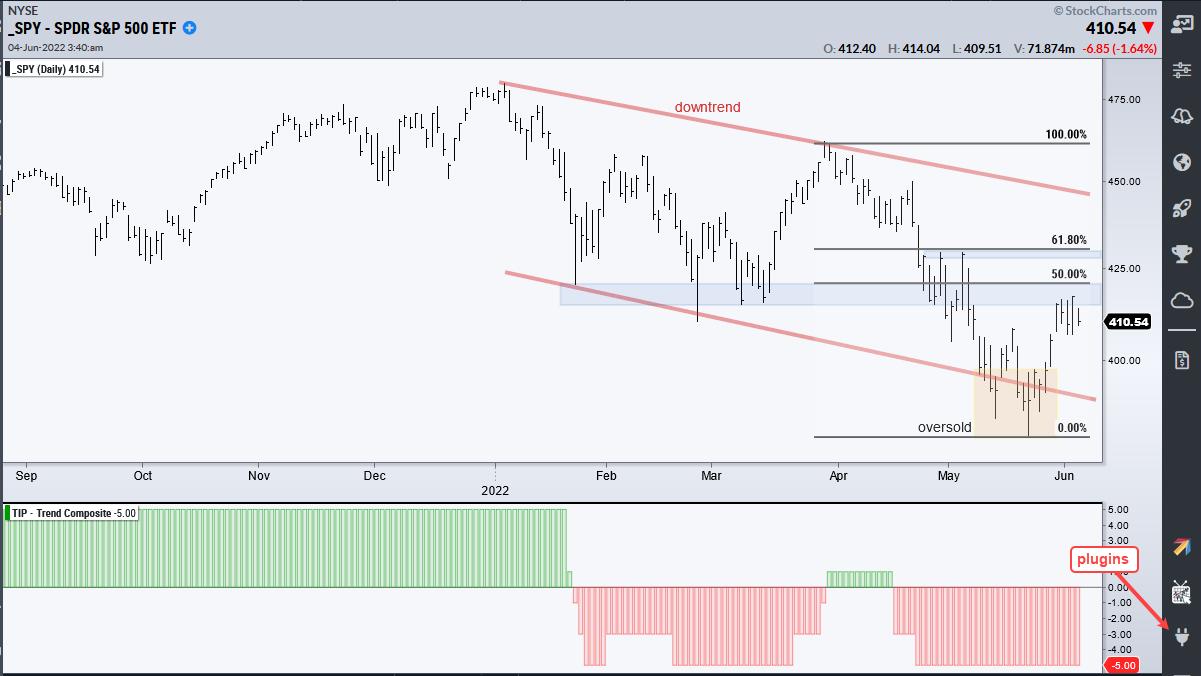
SPY became oversold with a move below the lower trendline of the falling channel (yellow shading) and bounced back above 410. With a bearish Market Regime suggesting that bearish outcomes are more likely than bullish outcomes, I am looking for resistance levels and areas where this bounce could fail. For this I use retracements, broken supports and prior resistance levels. A typical counter-trend bounce will retrace 50 to 61.8% of the prior decline. Broken support levels turn into resistance because this is where supply last overpowered demand. Prior highs mark levels were supply was stronger than demand. SPY hit the first resistance zone this week (blue shading) and fell back on Friday. Even if SPY were to break above this week’s high, I would still expect resistance just above in the 425-430 area because the Market Regime is bearish.
This week at TrendInvestorPro we showed why the one-day breadth thrust in late May was not enough to turn the tide in the Market Regime. There were some big moves in high-beta ETFs in the second half of May, but these were put in context using the Software ETF (IGV), which is still in a long-term downtrend. Click here for immediate access.
In this week’s Next Level Charting video (here), I elaborated on the counter-trend bounce in SPY and showed a weight of the evidence approach using five big offensive sectors. I also showed why platinum is the shiniest metal over the past month.
The Trend Composite, Momentum Composite, ATR Trailing Stop and eight other indicators are part of the TIP Indicator Edge Plugin for StockCharts ACP. Click here to take your analysis process to the next level.
—————————————