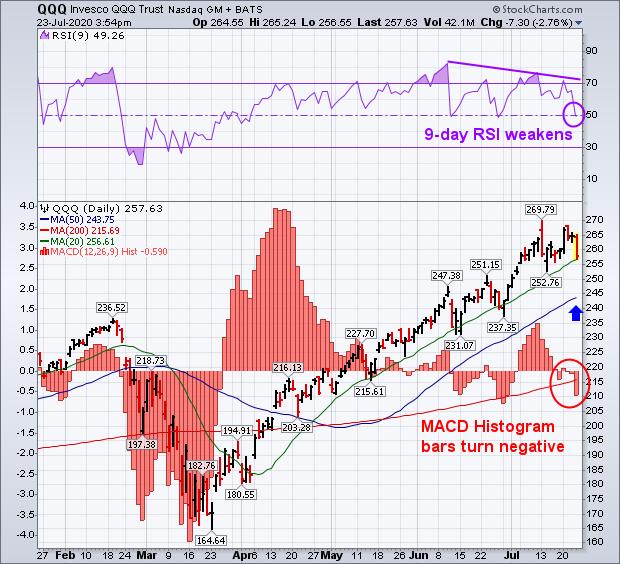
A selloff in the biggest tech stocks is putting downside pressure on stocks today; and is helping make the Nasdaq 100 the day’s biggest percentage loser. And it looks technically vulnerable to a deeper pullback. The daily bars in Chart 1 show the Nasdaq 100 (QQQ) testing its green 20-day average which is its first line of defense. If that doesn’t hold, a pullback toward its 50-day average (blue arrow) would appear more likely. Its short-term momentum indicators are also starting to weaken. The purple line in the upper box shows its 9-day RSI line falling back to the 50 line for the third time in the last month. It hasn’t traded below 50 since early April. Its recent pattern of declining peaks has diverged from the rising price action also suggesting some loss of upside momentum. The red MACD histogram bars overlaid over the price bars have fallen below their zero line (red circle) meaning that its daily MACD lines have turned negative. That’s another warning of more potential selling.
The day’s weakest sectors are technology (Apple and Microsoft -4%), communications (Alphabet and Facebook -3%), and consumer cyclicals (Amazon.com -3%). Eight of eleven sectors are ending in the red; with consumer staples, utilities, and financials managing small gains.
 Chart 1
Editor’s Note: This is an article that was originally published in John Murphy’s Market Message on Thursday, July 23rd at 3:04pm ET.