Nothing makes me happier than seeing my students surpass me.
Last Thursday, I was lucky enough to share the stage with Mark Croock, one of my top students.
Mark introduced his Shadow Trades strategy, which I have to say is incredible!
The way he knows right before a stock is about to drop is the closest thing to magic that I’ve ever seen.
What’s incredible is that Mark started with the same setups I teach every day, like the morning panic.
Thinking back to when he started, I distinctly remember a question he asked…
What makes a good morning bounce?
I realized that in order for traders to ingrain this into muscle memory, they need to know how to time these setups.
For that, I lean on price action.
Now, I talk a lot about ‘price action’ with my students. However, not everyone understands what that means.
It’s a pretty ambiguous term, I agree.
So let me explain how I look at it and use it with some examples.
Price Action in Action
When I talk about ‘price action’, I’m referring to the relationship between volume and price.
Breaking them apart, price is all about how something trades.
We know that each candlestick represents a high, low, open and close.
I analyze the each candlestick in relation to the prior ones.
Take a look at this one-minute chart of Wikisoft Corp. (OTC: WSFT).
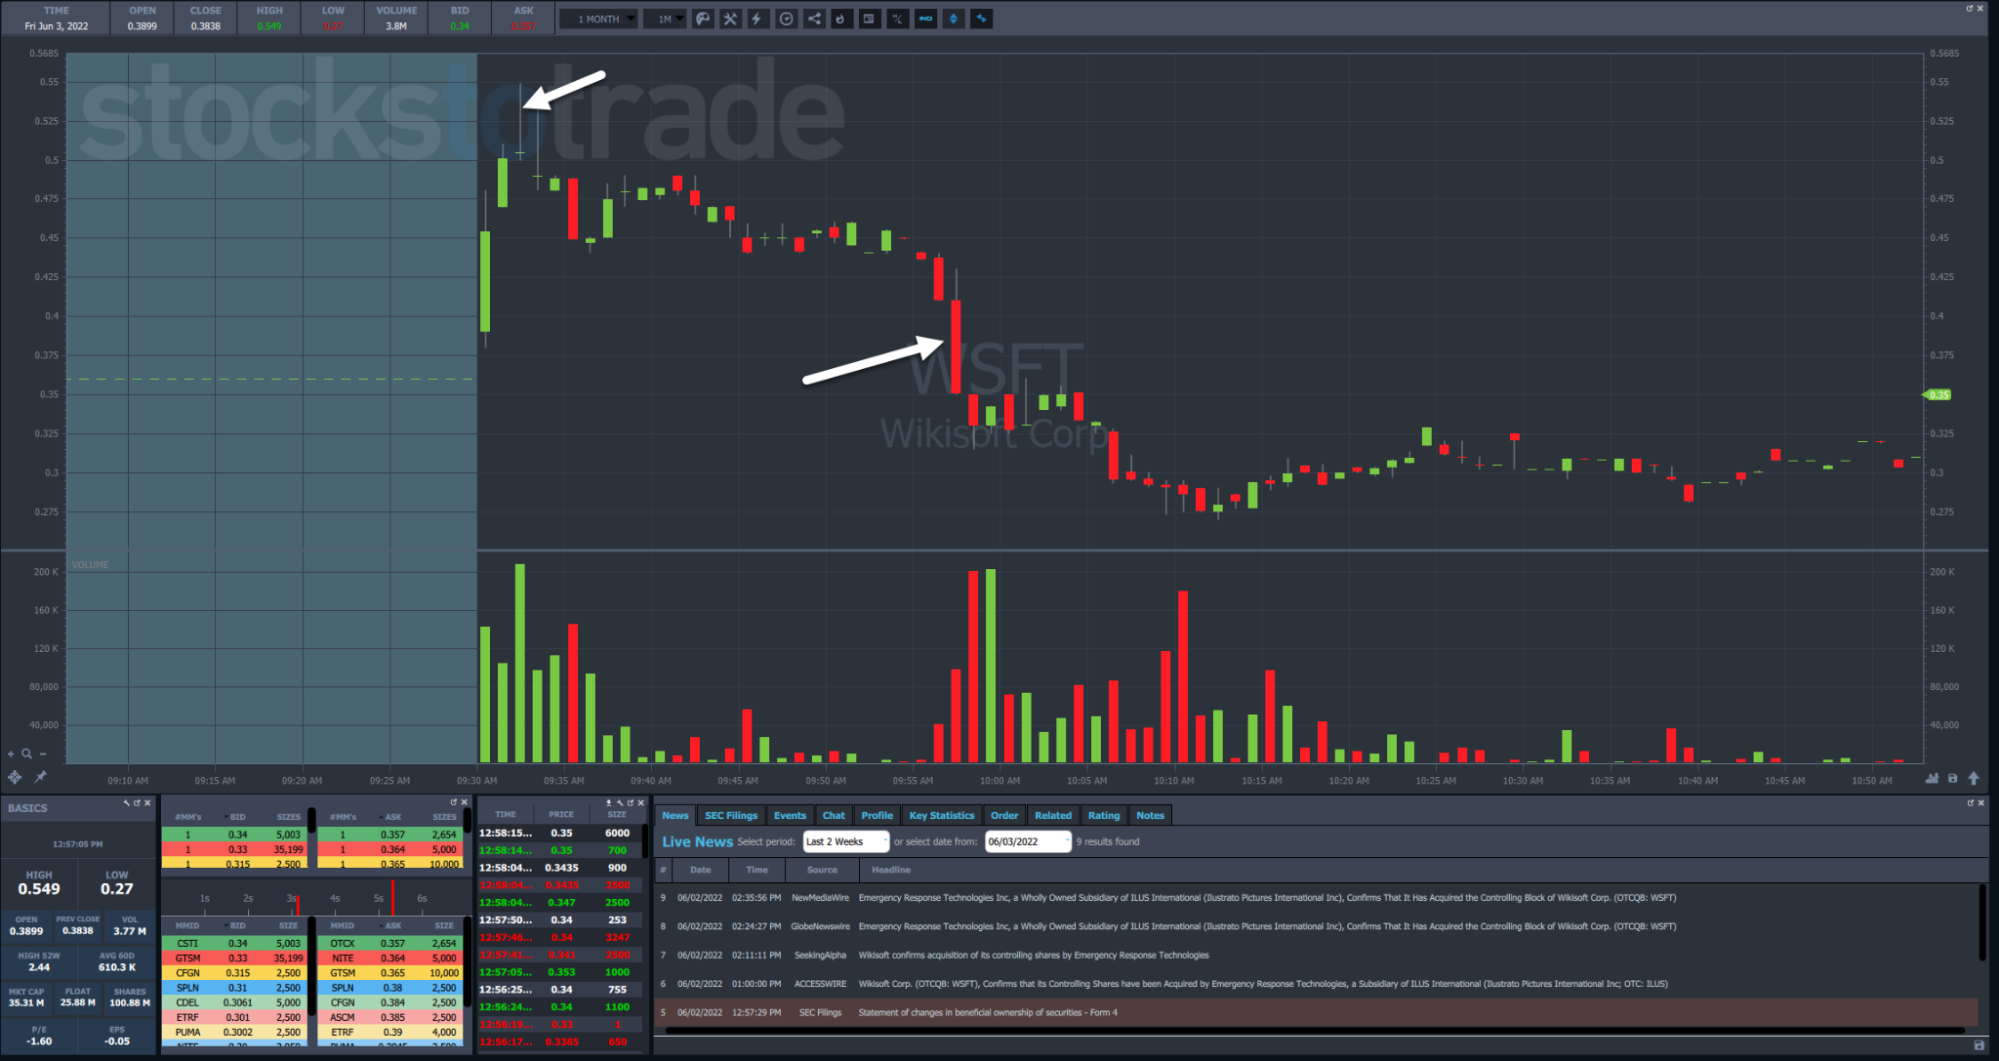
The left arrow points to a candlestick that made a long tail.
Essentially, the stock opened, ran higher, then fell back down to close right at the open.
Given this happened at a high on the day, it tells me sellers have determined this is where you may go and no further.
The right arrow shows a large red candlestick where the stock closed below the low of the day at that point and at the dead lows of that particular candlestick.
I would read this as sellers in control with few buyers stepping in.
Now, let’s bring in volume to the discussion.
You can think of higher volume as adding more emphasis to a particular candlestick. However, it has to be taken in context. Generally speaking, the open and close of the day see the heaviest volume. So, high volume there doesn’t necessarily mean as much.
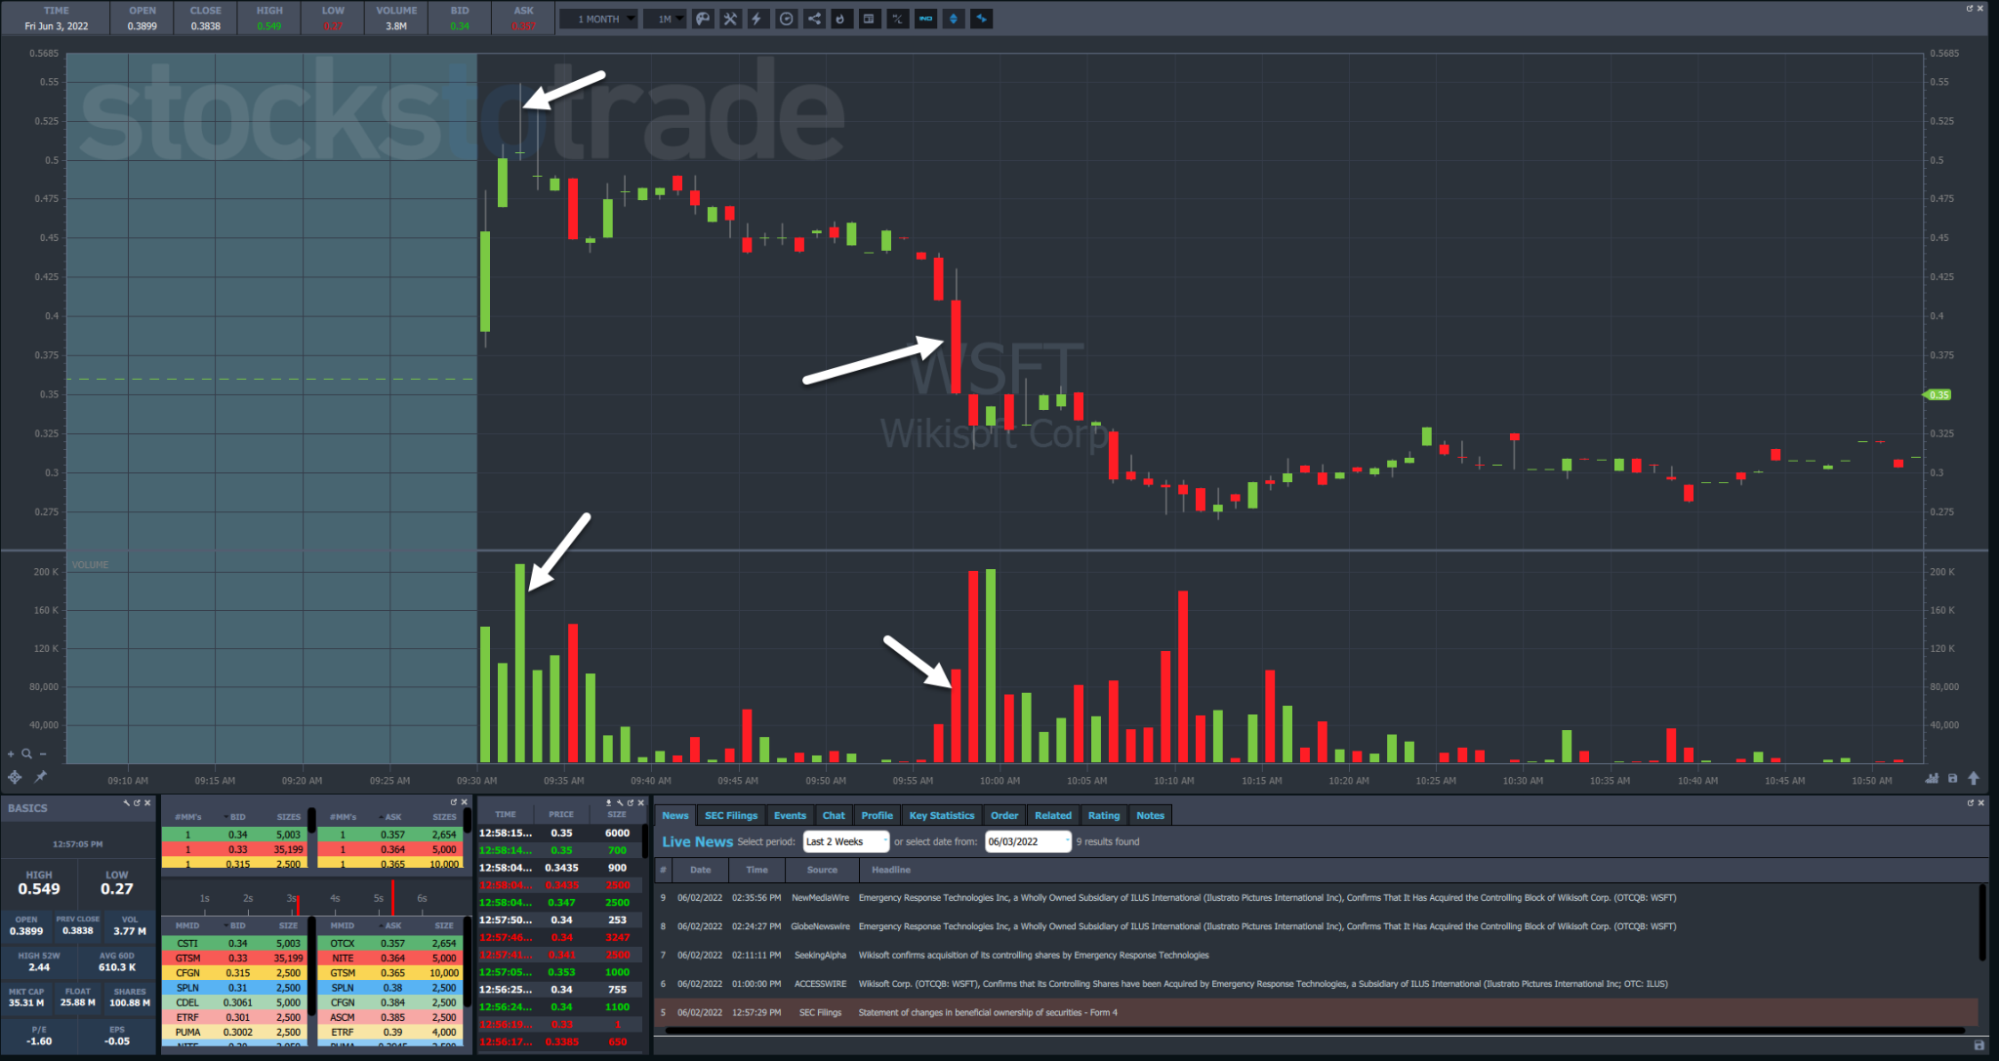
Now, let’s take that same chart and highlight the volume.
Here’s what’s interesting…
Notice how the volume on that third candlestick spiked above the prior two.
That’s like taking my read on the price movement and adding an exclamation point onto it.
So, it’s no surprise that candlestick was the high for quite a while.
Now, take a look at the volume on the large red candlestick.
It is growing and much greater than the last 15 candlesticks or so. However, it’s still lower than the volume near the open.
But the next two candlesticks are where things get interesting…
That’s where volume spikes hard for two minutes straight while the price of the stock stops dead in its tracks.
After such a sizable move lower, that tells me buyers stepped up to the plate and are preventing the stock from heading lower.
In fact, this is EXACTLY what I used to determine my entry into the stock because as a morning panic play, I expected the price to reverse in the other direction.
Another way to boost your confidence that a spot may hold is to look for support.
This can be as simple as marking swing points on the chart for the last several sessions as well as the daily closes.
Take a look at the chart below I marked up…
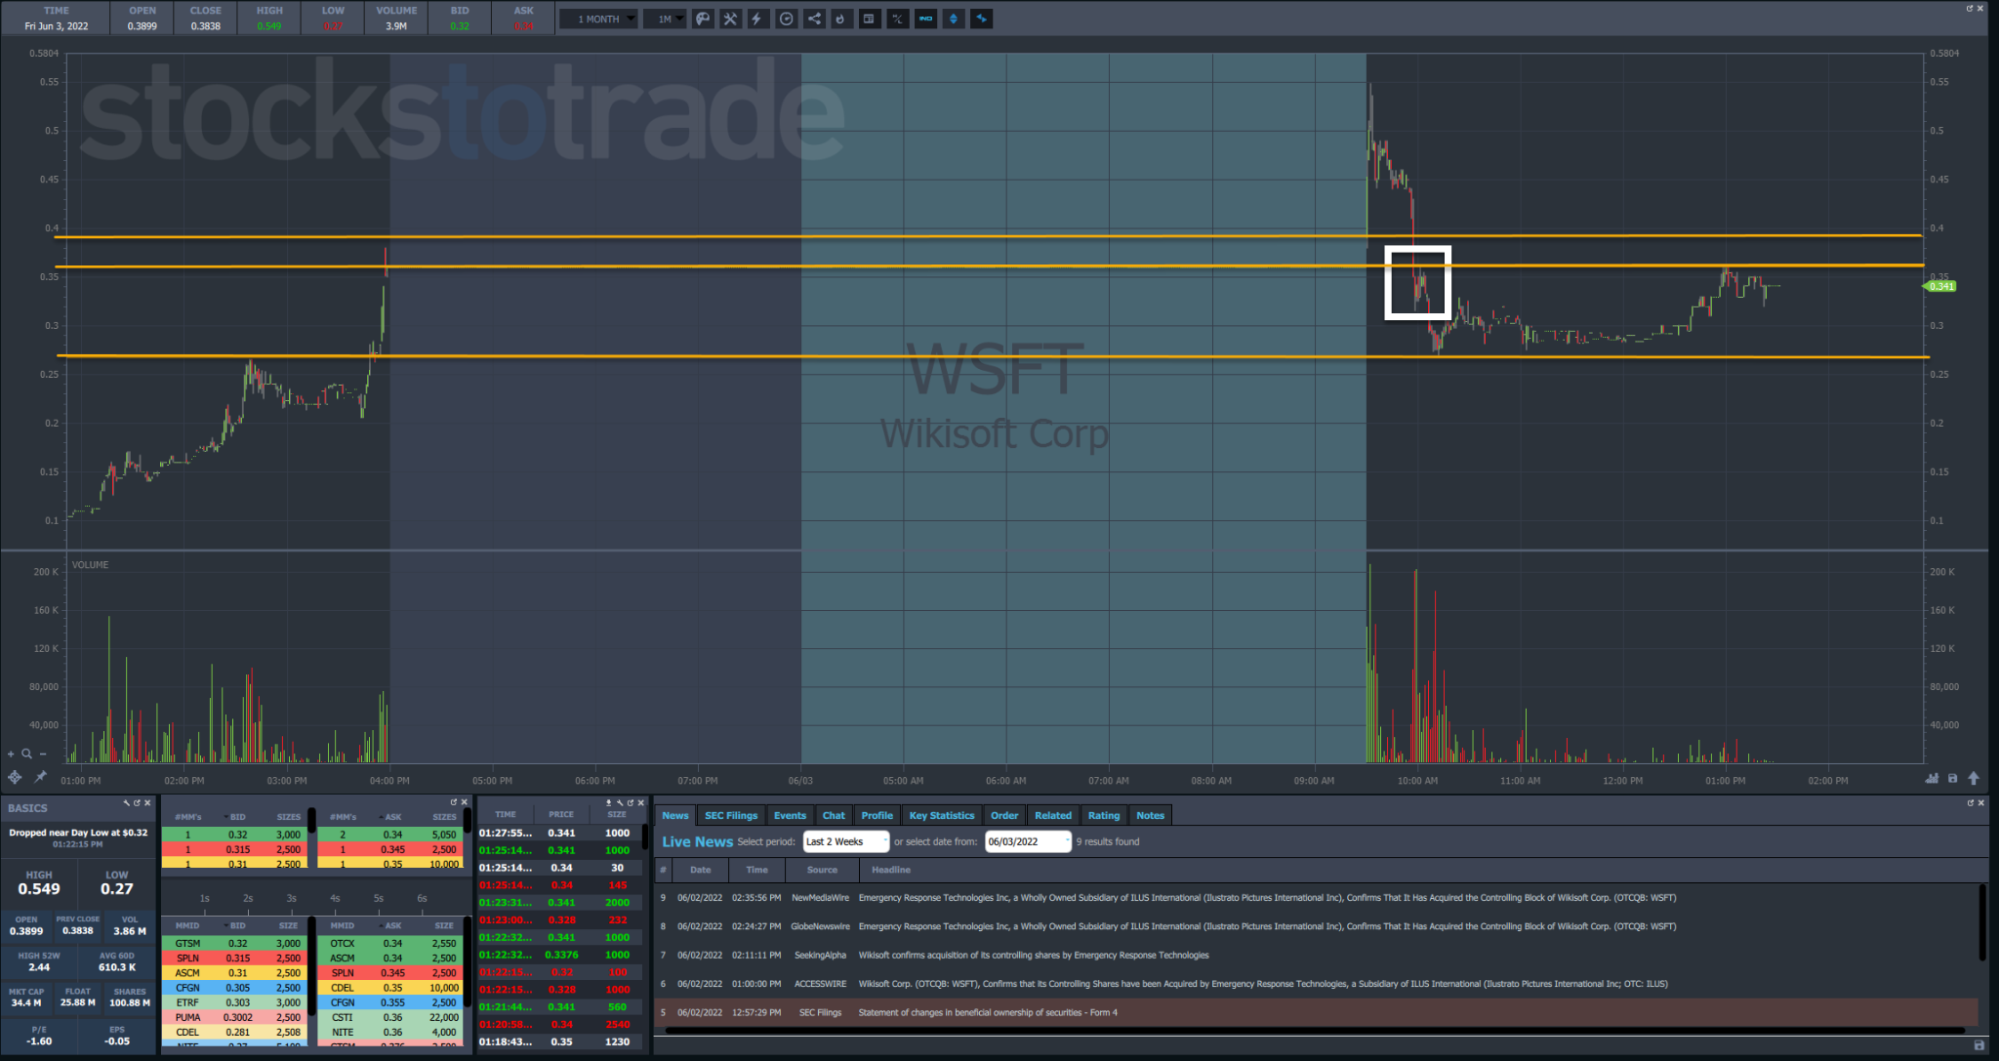
You can see in the white box where the entry I took lined up with the close from the prior day.
These don’t always have to be exact but in the general ballpark.
Final Thoughts
If you struggle to read price action, try breaking it apart as I did above. Look at the price first and then the volume.
It also helps to develop a narrative about what buyers and sellers are doing.
Ask yourself who’s in control, the buyers or sellers, as well as how many of them are there.
When you’re ready to take your trading to the next level, step up and take my Trading Challenge.
—Tim
The post What makes a good morning bounce? appeared first on Timothy Sykes.