It was a week of consolidation for the Indian equities; the markets struggled to move past the key resistance levels. At the same time, the NIFTY also continued to hold on to the key support points. The last five sessions kept the markets largely in a broad but defined range. The levels that had been violated by the markets on their way down continued posing resistance on the way up. Overall, the trading range for the previous week stayed at 416.40-points; quite exactly similar to the 405.75 points that were seen in the week before this one. All through the past five sessions, the markets refrained from displaying any definite directional bias. The headline index finally ended with a negligible gain of 52.80 points (+0.34%) on a weekly basis.
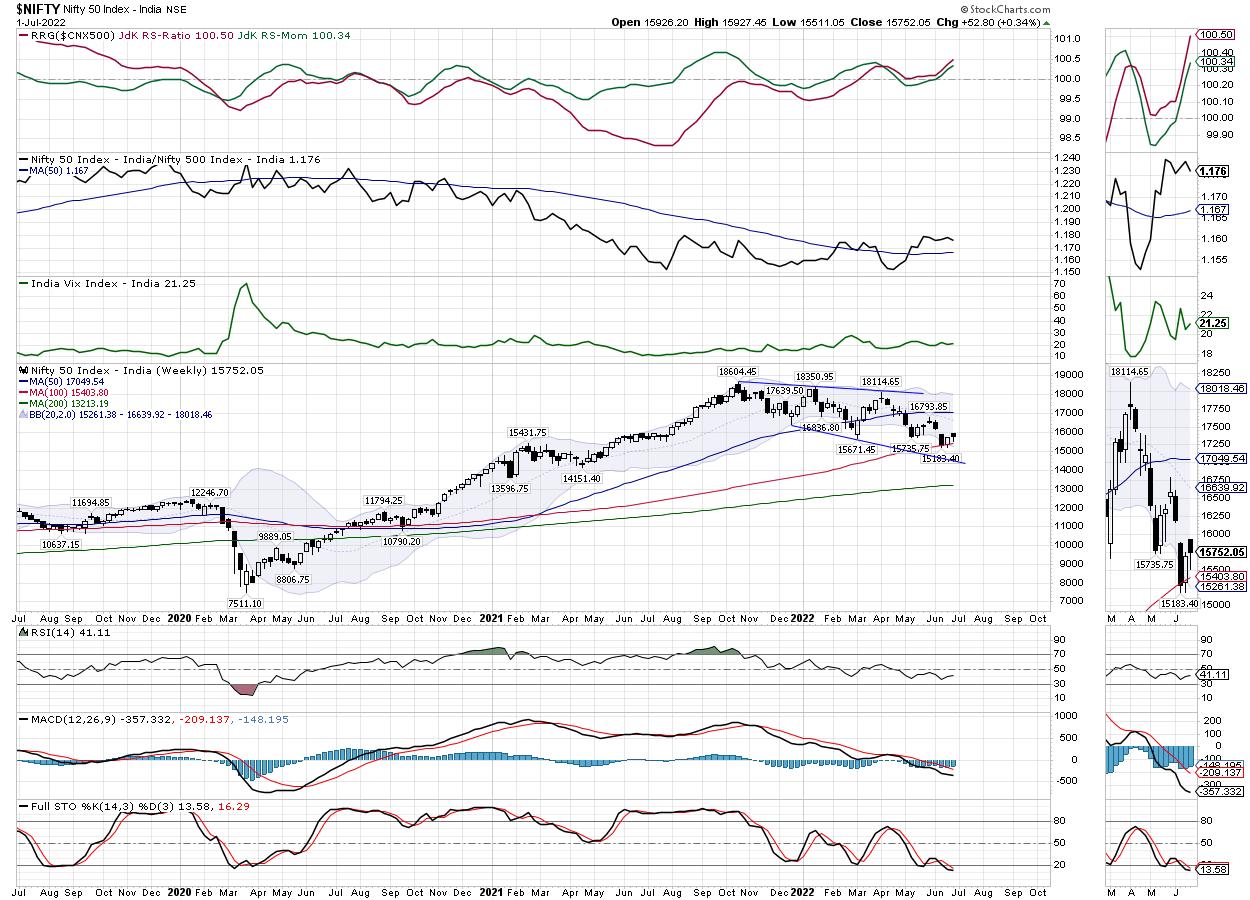
As we approach the coming week, there are a couple of levels on the daily and weekly charts that we will need to keep in mind. On a broader note, the zone of 15670-15700 was the support area for the NIFTY which it eventually violated and drifted below it. Now, on the way up, this very support zone is acting as the resistance and the index is struggling to keep its head above this. As the main case scenario, unless the NIFTY can penetrate the 15700 levels convincingly, runaway up moves will be difficult for the markets.
The NIFTY is also facing resistance at short-term 20-DMA which presently stands at 15827. On the support side, coming back to the weekly charts, NIFTY has successfully held on to the 100-Week MA which presently stands at 15404. It would be crucially important for the NIFTY to stay above this 100-Week MA on a closing basis.
The coming week is likely to see the levels of 16000 and 16350 acting as resistance points. The supports come in at 15400 and 15150. The trading range is likely to get wider than usual over the coming weeks.
The weekly RSI is 41.11; it stays neutral and does not show any divergence against the price. The weekly MACD is bearish and stays below the signal line. A candle with a slightly long lower shadow occurred. Apart from this, no other formations were noticed on the charts.
The pattern analysis of the weekly chart shows one of the most crucial inputs that can decide the trajectory of the markets in the coming days; that is the behavior of the NIFTY vis-à-vis the 100-Week MA which stands at 15404. This makes the level of 15400 a crucial support for the NIFTY on a closing basis; if violated, this can infuse some incremental weakness in the markets again.
The options data as of today shows upside staying capped at 16000 levels as this strike has seen the highest built-up of Call OI. This also coincides with the levels of resistance derived through classical technical techniques. The overall technical structure suggests that we will not see a definite defensive or a risk-on approach from the markets. We likely see a mixed set of sectors performing; defensives like IT, FMCG, Consumption, etc., may do better. At the same time, we might also see economy facing and high beta pockets like Auto, Banks, and Financial Services stocks doing good on a selective basis. It is recommended that so long as the NIFTY is staying above 15400, aggressive shorts must be avoided. All dips, until then, must be used to make quality selective purchases. A cautiously positive approach is advised for the coming week.
Sector Analysis for the coming week
In our look at Relative Rotation Graphs®, we compared various sectors against CNX500 (NIFTY 500 Index), which represents over 95% of the free float market cap of all the stocks listed.
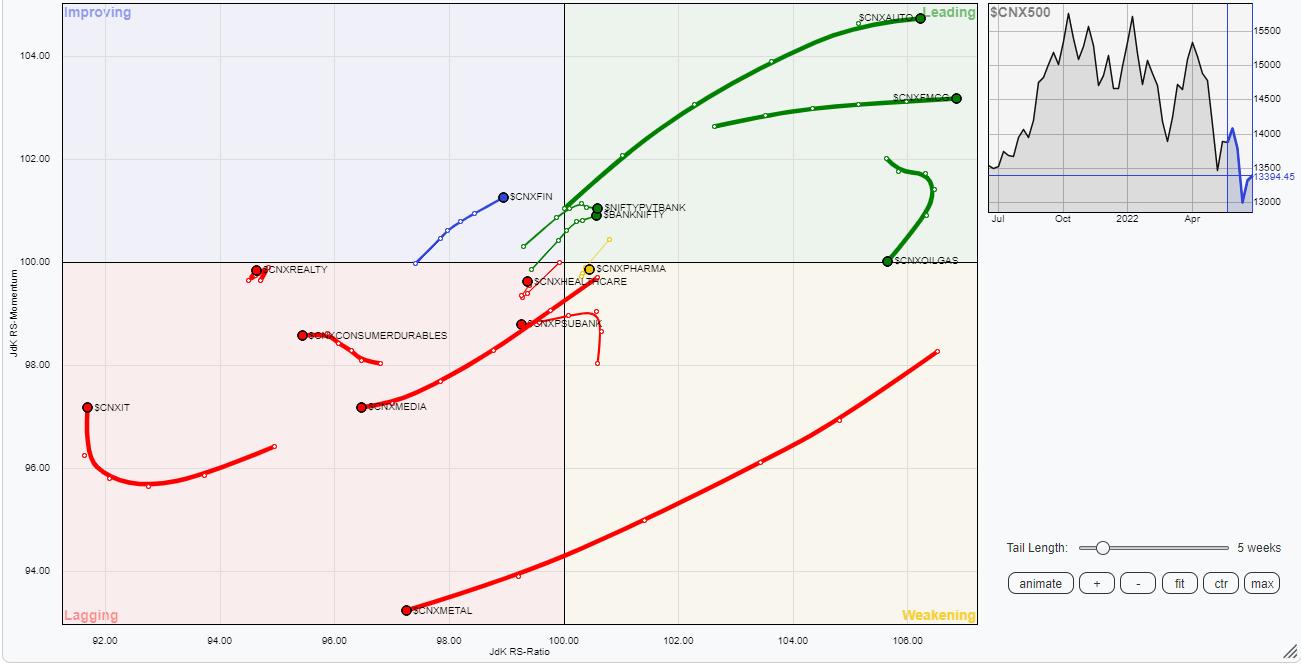
The analysis of Relative Rotation Graphs (RRG) does not show any major change in the sectoral setup as compared to the previous week. NIFTY Bank, Auto, FMCG, and Consumption indexes continue to stay placed inside the leading quadrant. These sectors are likely to relatively outperform the broader NIFTY500 index. NIFTY Infrastructure Index is also inside the leading quadrant; it continues to pare its relative momentum against the broader markets.
NIFTY Pharma, Energy, and PSE indexes are inside the weakening quadrant. Stock-specific shows cannot be ruled out, but overall these sectors may show some inclination to take a breather. The NIFTY Commodities Index has rolled inside the lagging quadrant.
NIFTY Metal continues to languish inside the lagging quadrant. It is likely to continue relatively underperforming the broader markets. Besides this, PSU Bank, Realty, and Media Indices continue to remain inside the lagging quadrant. NIFTY IT and Services sector index are inside the lagging quadrant but these groups are seen trying to improve their relative momentum against the broader markets.
Important Note: RRG™ charts show the relative strength and momentum for a group of stocks. In the above Chart, they show relative performance against NIFTY500 Index (Broader Markets) and should not be used directly as buy or sell signals.
Milan Vaishnav, CMT, MSTA
Consulting Technical Analyst
www.EquityResearch.asia | www.ChartWizard.ae