The Indian equity markets continued their unabated liquidity-driven up move and ended with yet another week with gains. The past five days remained less volatile than expected as the NIFTY remained in a defined range of 275-odd points. The directional move, however, remained unidirectional as the Index continued to move higher. The banking and financial stocks grossly outperformed the frontline markets. Yet despite this relative underperformance of NIFTY, the headline Index still ended the week with net weekly gains of 276 points (+2.43%).

The “Dollar Deluge” was dominant on the street and the surge remained squarely driven by the huge gush of liquidity. The BankNifty played a massive catch-up as this Index gained a massive 2224.20 points (+9.97%). The volatility to went to further decline as the INDIAVIX came off by 7.97% to 18.35 on a weekly note. Given the present technical setup and with ongoing weakness in the US Dollar, we are likely to see NIFTY moving higher and the financial stocks, along with other defensives, staying resilient. In event of any consolidation, it is expected to stay within a broad range. Market participants will need to guard against any likely surge in Volatility at higher levels.
The coming week is expected to see a stable start. The levels of 11735 and 11885 will act as resistance points. The supports will come in at 11410 and 11330. The coming week is also likely to have a bit wider trading range on either side.
The weekly RSI is 64.43; it has marked a fresh 14-period high, which is bullish. The RSI is neutral and does not show any divergence against the price. The weekly MACD is bullish; it trades above its signal. The RSI also appears to be breaking out from a sloping trendline. A strong white body occurred on the candles. This shows a directional consensus of the market participants.
The pattern analysis shows that the NIFTY is surging towards the lower trendline of the channel that it violated on its way down. If the NIFTY has to test that pattern resistance, it has some more room on the upside to cover to do that. Importantly, it is now trading significantly above its key moving averages and well within the primary uptrend.
All in all, we will see some external news flows driving the domestic markets. Importantly, the even larger factor that will continue to fuel the markets will be the weakness in the Dollar. If the weakness persists, it may push the markets higher. However, any consolidation or a mild pullback of the Dollar index may temporarily apply some brakes on the unabated rise that we are witnessing. Given this, we recommend following the up moves in the markets by staying stock- and sector-specific in the approach. Staying with the banking, and other defensives will help if any consolidation happens. Broadly speaking, a positive outlook is advised for the coming week.
Sector Analysis for the Coming Week
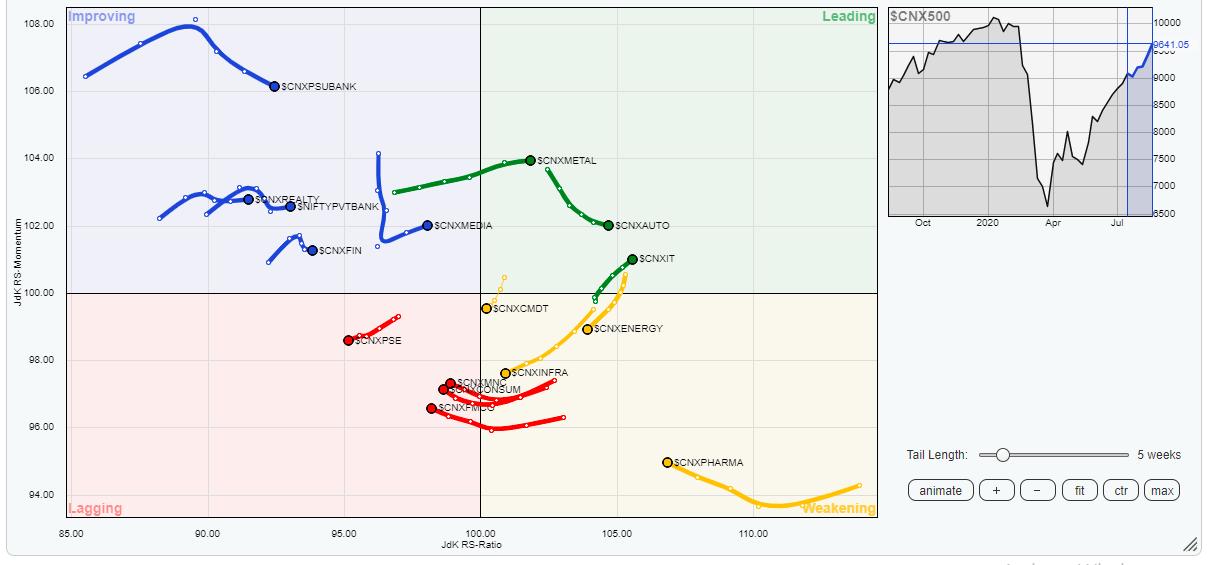
In our look at Relative Rotation Graphs®, we compared various sectors against CNX500 (NIFTY 500 Index), which represents over 95% of the free float market cap of all the stocks listed.


The review of Relative Rotation Graphs (RRG) shows that broader markets will continue to rule the roost in the coming week as well.
The NIFTY Small Cap and NIFTY Midcap 100 indexes have entered the leading quadrant. Along with these broader indexes, the NIFTY Metal, Auto and IT groups are also placed in the leading quadrant. These broader indexes and groups are set to relatively outperform the broader NIFTY500 Index over the coming week.
The NIFTY Services, PSUBanks, BankNifty, Realty and Media sectors are placed in the improving quadrant and appear to be maintaining their relative momentum against the broader markets. They are also likely to stay resilient and improve their performance over the coming days.
FMCG and Consumption are in the lagging quadrant, but appear to be attempting to consolidate their performance. These groups might offer some stock-specific and isolated performance in the immediate short term. The NIFTY Infra and the Pharma index are in the weakening quadrant. These groups are likely to relatively underperform the broader markets along with the NIFTY PSE group which is seen rotating negatively inside the lagging quadrant.
Important Note: RRG™ charts show the relative strength and momentum for a group of stocks. In the above chart, they show relative performance against NIFTY500 Index (Broader Markets) and should not be used directly as buy or sell signals.
Milan Vaishnav, CMT, MSTA
Consulting Technical Analyst