The upper extended trend line shows that the Double Top breakout not only fizzled out, but the price action failed to move past that double top resistance several times. This has reinforced the credibility of this resistance.
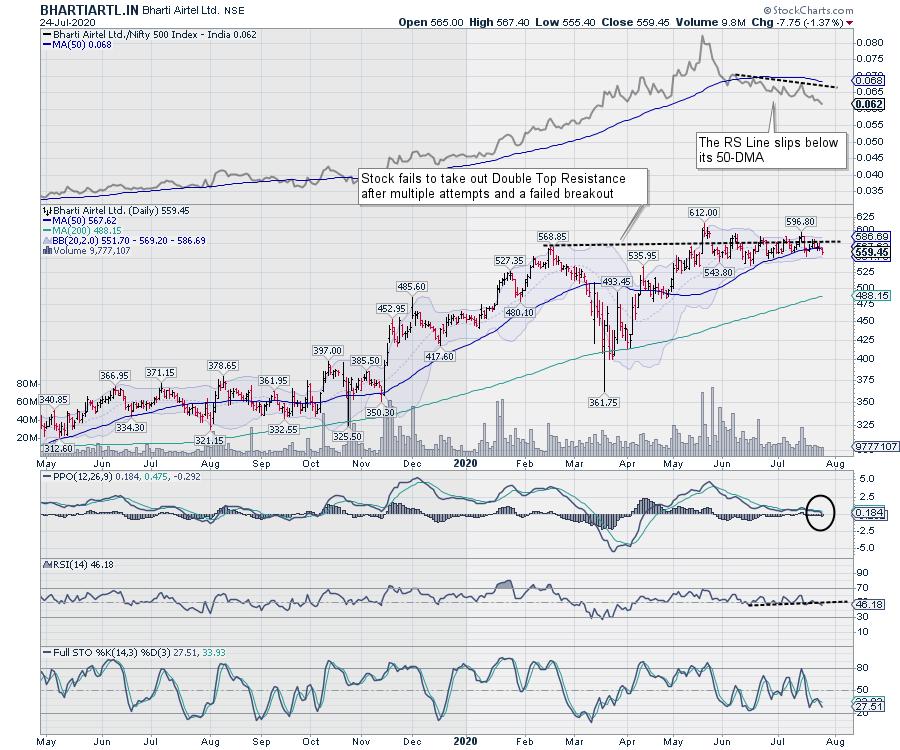
Presently, the price has slipped below the 50-DMA.
The daily MACD has shown a negative crossover; it is bearish and trades below its signal line. The RSI has marked a fresh 14-period low which is bearish. The indicator also appears to be breaking down from multiple bottoms to a new low.
The stock is rotating in the south-westerly direction on the RRG when bench-marked against the broader NIFTY500 Index. The RS Line against NIFTY500 has already slipped below its 50-DMA and is trending lower.
If the price action moves in the expected direction, then the stock may test 535-530 levels. Any move above 575 would negate this view.
Milan Vaishnav, CMT, MSTA | Consulting Technical Analyst | www.EquityResearch.asia
Disclosure pursuant to Clause 19 of SEBI (Research Analysts) Regulations, 2014: Analyst, Family Members or his Associations holds no financial interest below 1% or higher than 1% and has not received any compensation from the Companies discussed.