The US Dollar has been dropping for a few months now, but this week it accelerated lower on the break of the two-year trend line. I wrote about the dollar in this Canadian Technician article on Thursday, and its position as the global currency is clearly something to watch.
Many long term charts are also testing their trend lines or major levels. On StockCharts TV’s Charting The Second Half panel held last Saturday, I mentioned that $COPPER was trying to break out as the dollar breaks down. I did show a 10-year long term chart, but it is even clearer when the chart shows the last two major breakdowns in the dollar.
I have used the quarterly chart setting on StockCharts to generate this chart. This is a macro focus, so it is not a day-to-day look. While the copper move is happening in coordination with a breakdown in the dollar right now, the wiggles don’t track that closely. For me, it is more important to be aware of the big picture and try to set up for that.
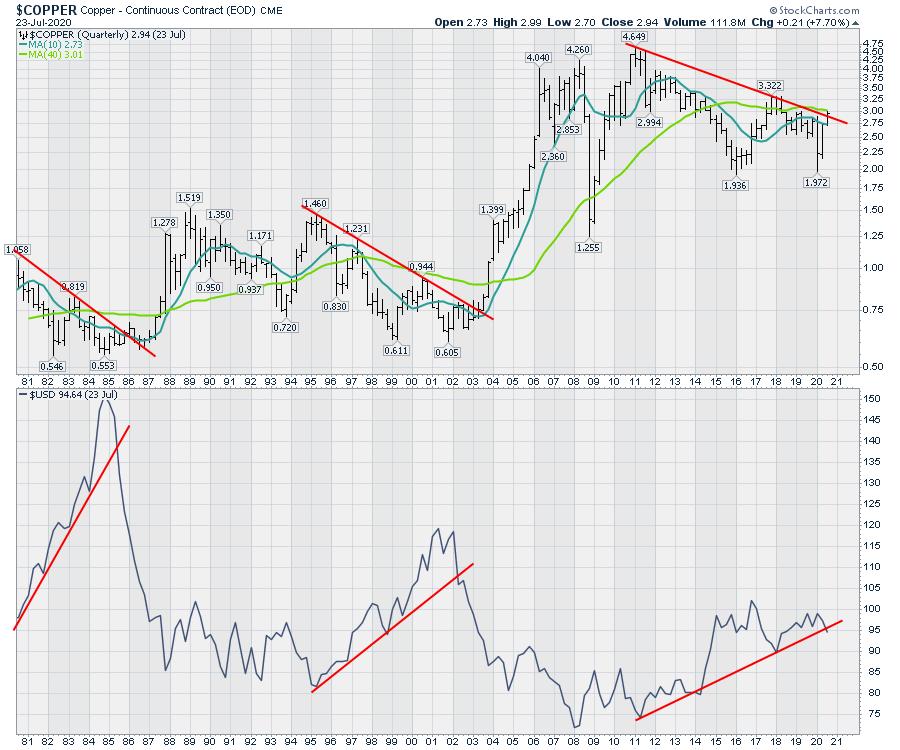
What we need to watch for over the near term is the bounces in the dollar and Copper reacts. In general, as the dollar falls, commodities rise. I’ll be following this macro theme as I like the speed of the moves in commodities and commodity-related trades.
Below is a chart of gold and the US Dollar. I have moved to the larger theme for the dollar, where it is making a lower high on the 40-year chart. But this chart also shows the macro view for these two trend lines. To me, this suggests that the dollar is making a decisive move at a very important inflection point, which is the apex of these two long-term trend lines. So far, the move is lower, below the 10-year uptrend line, but the chart is using quarterly endpoints, not daily closes.
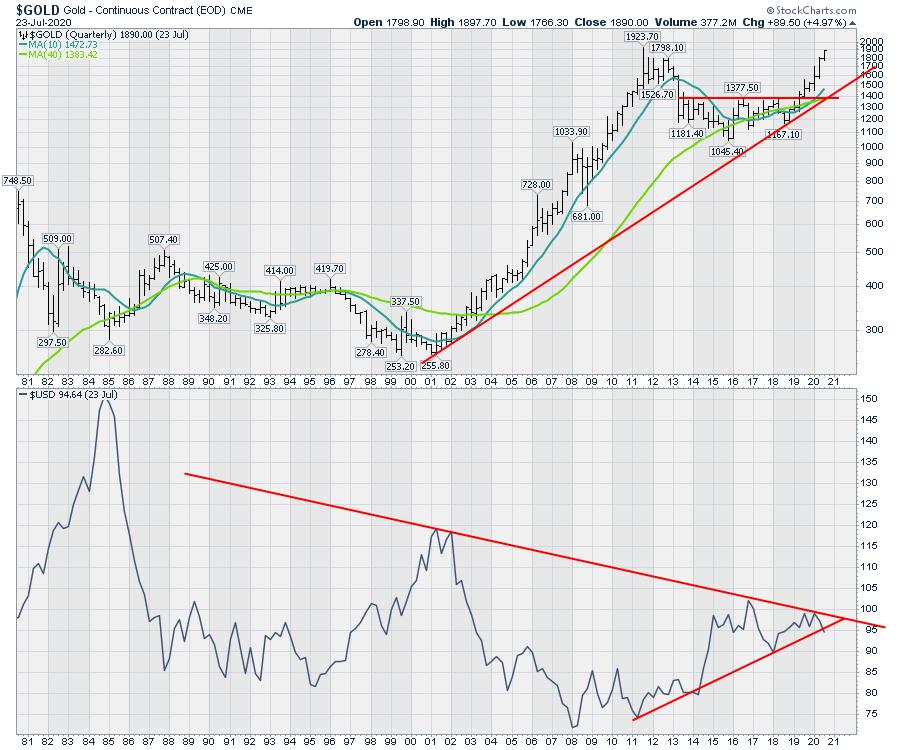
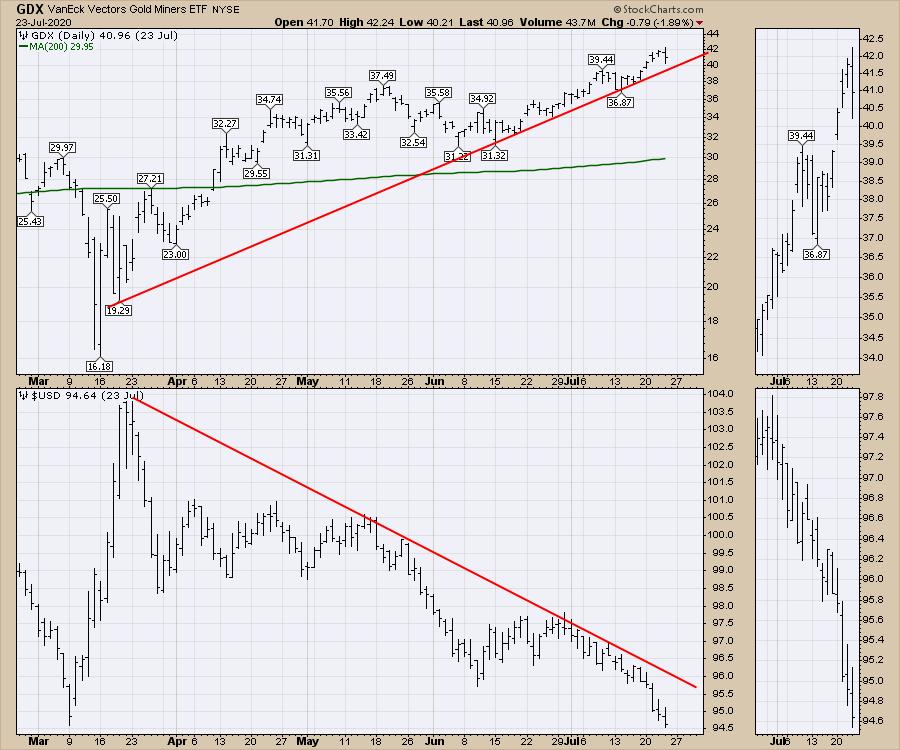
It is important to keep the time scale in context. Whether the dollar stops falling here or continues lower is a big deal on the macro time scale. Setting up a trading bias around the direction of the dollar can be helpful in the big picture, but difficult to hold through day-to-day. A good example of that was the weakness in the gold mining ETF on Thursday, even though the dollar moved lower (last bar on the chart).
As the quarter unfolds, we’ll need to be watchful of the US Dollar trend. But this is the quarter that is changing trend if the dollar closes here. For major institutional investors, these can be long-term signals they use to help guide them in allocation. A rising dollar or a falling dollar matters. The last two years has seen a very flat dollar trading in a tight sideways range. Just eyeballing the chart, the dollar traded between 95-100 around 80% of the time.
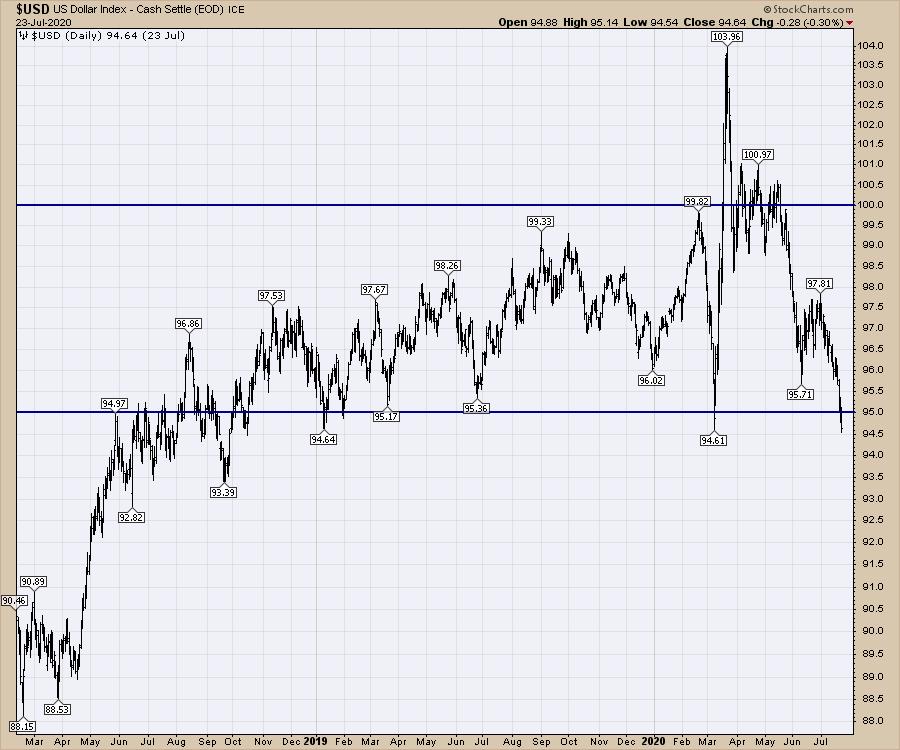
To conclude, on a daily, weekly, monthly and quarterly basis, the dollar is at a massive point for technicians. The daily is breaking down and the weekly chart made an important break this week. Where it falls on the July month-end could be another important signal change should it close below the 10-year monthly trend line. The decision is happening in front of our eyes. Don’t miss the big implications of the world currency changing direction.
I do a lot of macro work for clients who like a wider view. If my views are helpful for setting your macro direction, I’ve set up a $360 discount you can receive by entering the coupon code “dailyfive” on this link, Greg’s Annual Membership. You can learn more about my work by perusing GregSchnell.com. If the macro significance of the US Dollar change this week is news to you, you’ll find a lot more ideas how to invest around those changes in my newsletter and video offering.