 What is the singular attribute absolutely ALL successful investors you can name possess? It’s resiliency! Consistency, profitability and longevity demand that an investor maintain an even keel through many challenging market cycles. The essential tool they all use are their “Routines”. The end result: resiliency.
Routines are the Teflon for investors to avoid market catastrophes. Routines are the Velcro holding investors’ equilibrium intact. We know of no other successful investing programs that divulge 100% of its routines. Many black box software trading systems claim phenomenal results, but transparency is not available. Hence, 100% investor commitment is impossible without 100% transparency.
Our ChartPack Dashboard is the ultimate collection of tested and proven stock market routines. It’s the basis of our long-term success, and it’s 100% transparency has facilitated contributions and improvements by a large user community numbering in the thousands. There exists a simple proven correlation. Routines produce resiliency, and resiliency produces long-term profits.
Markets are by their nature always changing and always challenging. Maintaining your footing is paramount and your routines keep you tethered to what is the actual reality of the market — not the news media’s portrayal of reality. Simple routines executed individually, but then grafted together collectively will achieve a number of requisite objectives.
- Your familiar routines help you calm yourself and remain centered during market volatility. When you’ve embraced your routines with both your head and heart, you are much less likely to be pushed into disequilibrium where bad decisions reside. Instead, you’re able to remain centered and respond successfully and appropriately.
- Profits are based on consistently executing the highest probability trades the market presents you. They provide the insights and understanding as to where these high probability trades presently exist and precisely what they are.
- When you make a commitment to become a proficient investor and apply yourself, you’ll find that it is your routines that anchor you so you aren’t easily confused by other alluring siren calls tempting you to sail onto the rocks. In other words, you aren’t swayed by the media and its talking heads.
Onward! Here are some of the more significant updates to this quarter’s Investor Dashboard.
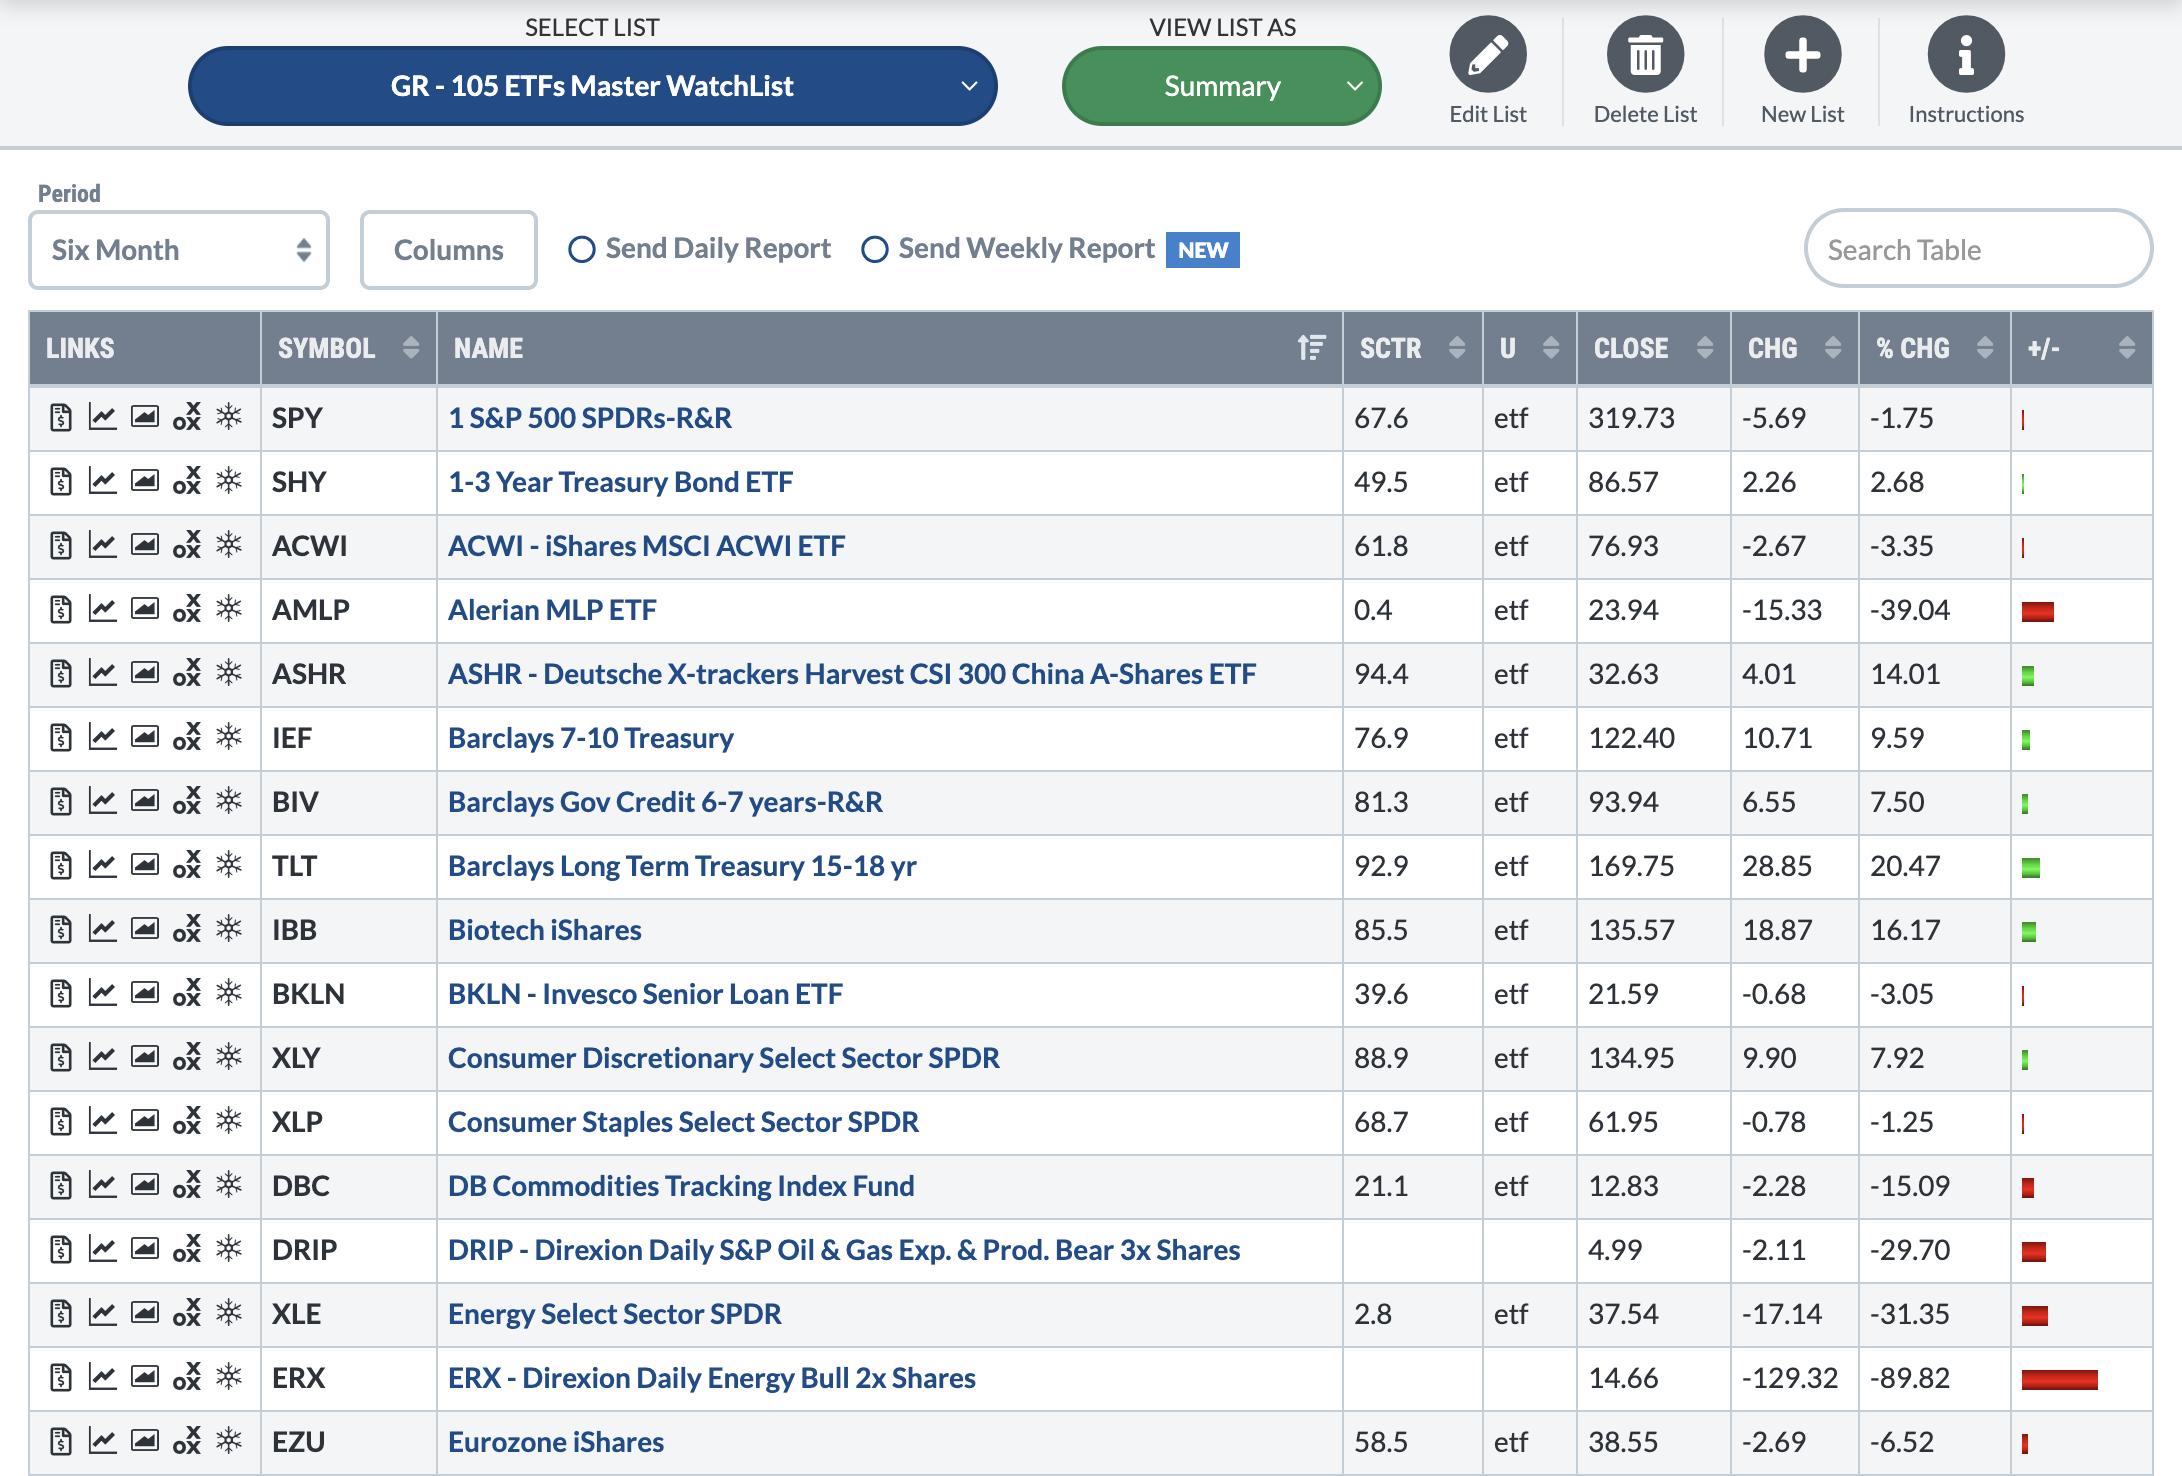
#105: ETFs Master Watch List
We all have our own unique peep holes when it comes to how we garner insights into the present market. Sounds a bit off-color, but it’s more profound than profane. Here’s why. Grayson and I review this ChartList each month, and the insights never disappoint. Label this little routine as a “high leverage monthly activity” that we encourage you to adopt.
The ChartList is populated with the top 100 ETFs (and then some) ranked by monthly trading volume. It’s literally a popularity rating. Yes, the regular popularity queens are always being asked to dance — SPY, QQQ, IWM, etc. No surprise there.
What you should watch for is who are the new dance queens. This quarter, it’s obvious that three themes are playing out. We’ve added 17 new ETFs (based on trading volume) but most are clustered by specific dance music.
- Volatility theme: A number of the high volume ETFs added this quarter deal with trading based on VIX.
- Energy theme: Clearly very big on many dance cards, and four new ETFs added, such as UCO.
- Financial theme: Four of the new additions focus on Financials and Bonds, such as FAS.
Equally insightful is what is dropping off the list. A number of leveraged ETFs — such as DGAZF — no longer have the trading volume to earn a spot on our dance card.
Three other quick observations. Based on volume, the aggressiveness of many traders who buy and sell leveraged ETFs shocks me. Country funds continue to offer opportunities, but more so for traders and perhaps less so for investors as their popularity swings in and out quarterly. Finally, there seems to be an ETF now for every desire. A case in point is “JETS”, which is a fairly high volume ETF composed of global airlines for the most part. If you shorted this in February, you’re rich now! We encourage you to embrace this ChartList as part of your monthly routines. The insights will justify your time.
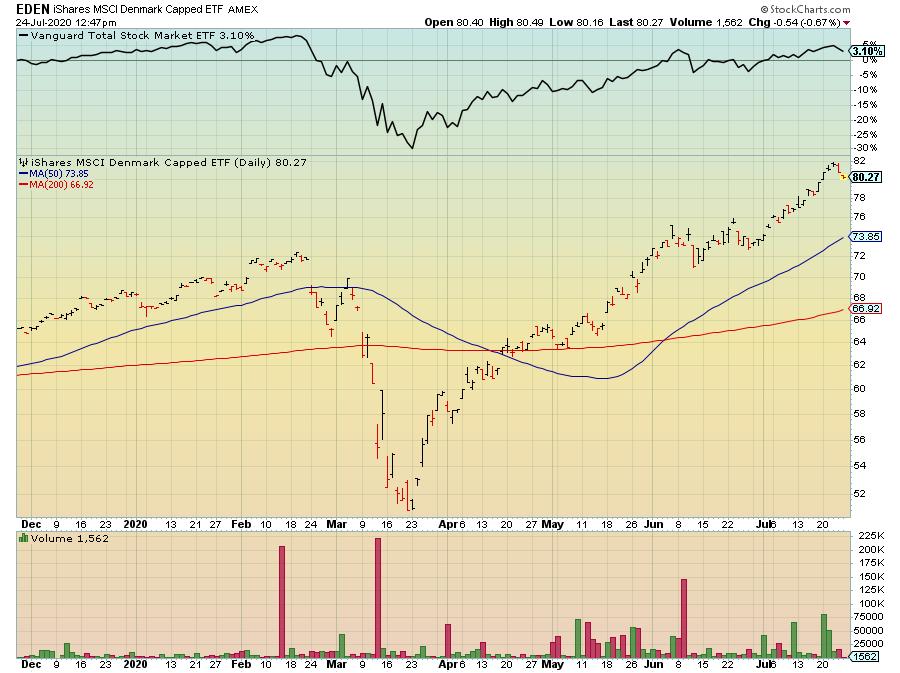
#206: Country Funds
As we mentioned above, for those of you who lean a bit more to the active trading side of the investment arena, we always like to remind our community that this ChartList of 55 country funds never disappoints. Each quarter there are some wonderful winners. Year-to-date, if you think the US markets are the only place to be, you’d be incorrect. There are seven winners here who all-out performed the S&P 500 — led by Denmark with its 14.25% gain YTD (as of July 16). This ChartList is worthy of your attention.
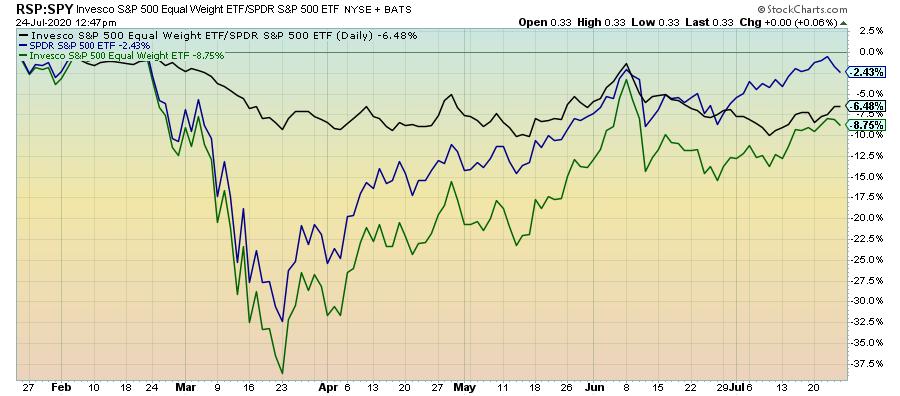
#300: Market Breadth
This ChartList has long been a regular go-to indicator of the market’s true picture. It’s essential in understanding which equities are participating and with what amount of conviction is the market trending. In other words, how big is the party. Since $SPX (ETF – SPY) or the S&P 500 is so widely followed, we have added a new ETF to this ChartList. SPY is cap weighted. Therefore, the top ten stocks (10 out of 500, or 2%) account for about 27% of the index. Microsoft, Apple and Amazon alone account for 15%. It is thus useful to compare the Invesco S&P 500 equal-weighted ETF (RSP) to SPY. When RSP is outperforming SPY, it signals a wider participation and a healthier market. Check out this new chart.
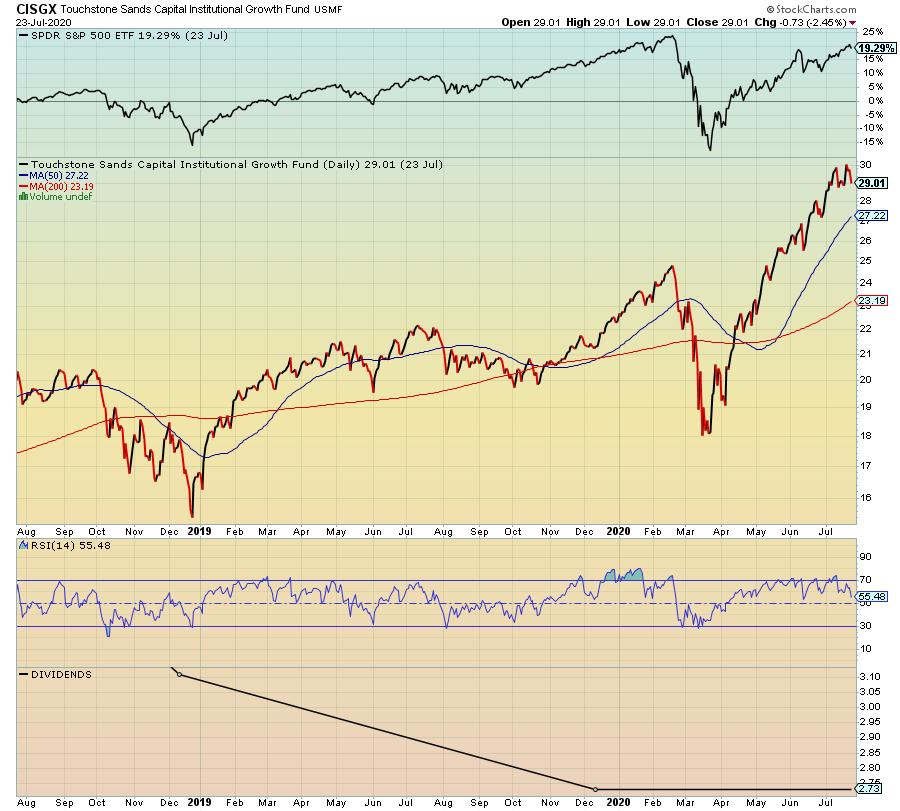
#416: Proven Stock Pickers
We have added a sixth fund to our all-star stock pickers ChartList. This list contains only mutual funds that have out-performed the S&P 500 for the past three, five and ten year periods. The new fund — Touchstone Sands Capital Growth (CISGX) — has four managers with the lead manager having been at the helm since 2005. The reason we track these funds is to X-ray their respective holdings. There are some equities owned by all six of these all-star stock pickers. Perhaps you too should own some. The equities are all listed in the ChartList Notes beneath the summary list. Do review these.
Tracking the smart money has been a strategy that has paid off for us handsomely over the years. Many insights here, such as five of the six funds just purchased DexCom (DXCM) and four bought Twilio (TWLO). Lots more in the notes.
#420-12 to #420-90: Fidelity Sector Funds
Here are a few highlights from this quarter’s Fidelity sweep:
- In the midst of a global pandemic, it was no surprise to see lots of activity in the Biotechnology portfolio (#420-18). in particular, the fund clearly took a substantial position in Amgen (AMGN), while we noticed that Vertex (VRTX) was dropped from the top 10 of multiple portfolios.
- The Global Commodity portfolio (#420-45) was another active fund of note, which caught our eye given some of the movements we’ve been watching lately in the commodities space.
- One of the most active funds this quarter seemed to be the Industrials portfolio (#420-54), which saw multiple new additions to its top 10 – and dropped a major Defense industry name from the group.
- Also active – the Transportation portfolio (#420-86). Trucking was a clear theme here with some of the new additions to the fund’s top 10 list. Look there for two names in that ChartList that operate in the trucking space. We’re watching those charts closely!
BONUS – The ChartPack Is Now ACP Ready!
 As you’ve probably heard by now, StockCharts just launched v1.0 of StockChartsACP, a new interactive, full-screen Advanced Charting Platform. Among many other powerful features of this all-in-one charting package, the platform brings you true dynamic charting with the ability to scroll back and forth through time, drag indicators and overlays up, down and around your charts, manipulate the y-axis with your cursor and much more. In short, we’ve taken our award-winning approach to charting and dialed it up to 11.
If you haven’t already, be sure to read Grayson’s announcement article from ChartWatchers earlier this month to learn more about all that’s included in this latest version of ACP.
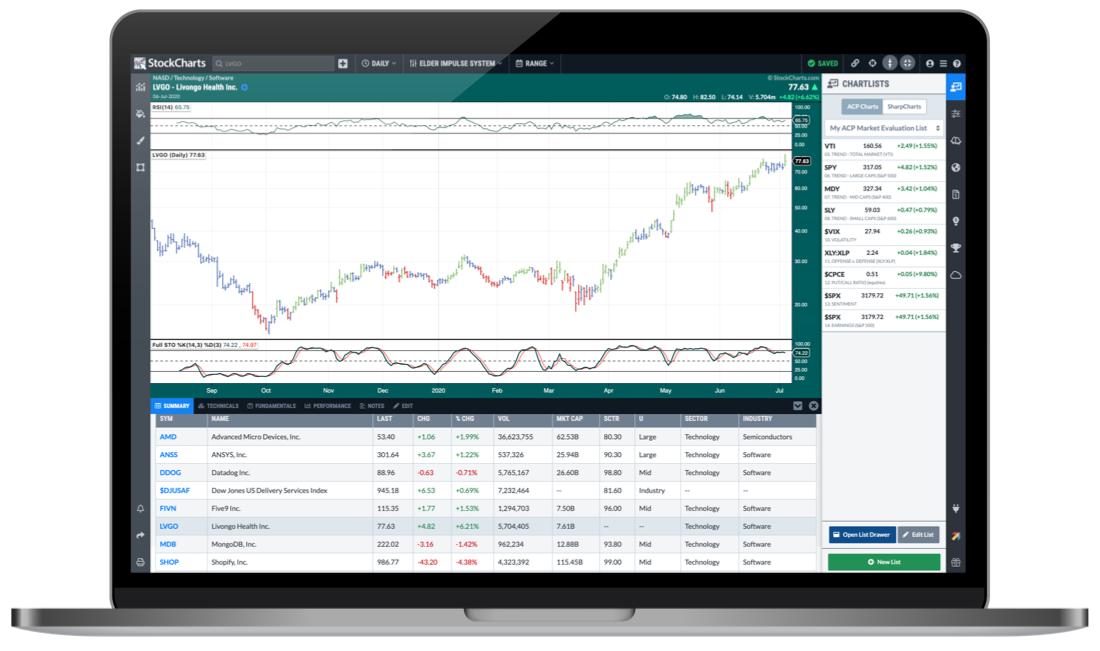
Now, one important feature of the new platform is the ability to view ACP versions of your existing saved SharpCharts. You can open the ChartLists sidebar (on the right) and click the “SharpCharts” tab to see your current ChartLists. You can then click on each symbol in the list to see an ACP chart that will very closely match the saved SharpChart. It’s a great way to explore the new world of ACP, or quickly get set up with some of your favorite indicators and other chart settings.
What this means for all you ChartPack users is that you can easily explore the ChartPack in ACP, right out of the box. When you install the latest version of our ChartPack, all of the ChartLists and associated SharpCharts will be installed into your StockCharts account. You’ll then be able to head over to ACP and browse through dynamic versions of all the charts included in the ChartPack.
Already have the ChartPack? Here’s how to upgrade:
- Log in to your account, then visit the “Manage ChartPacks” page (accessible from the bottom of the Members Dashboard or from the “Your Account” page).
- In the table that appears, find the entry for the “Tensile Trading ChartPack” (if you don’t see the Tensile Trading ChartPack listed, that means that you haven’t purchased it. Click Here to do so now).
- Click the “Re-Install” button next to the Tensile Trading ChartPack to start the update process
The download should take about 10 seconds, after which you can explore the new ChartLists and other updates!
New to the ChartPack? Here’s how to install it:
If you’d like to add the Tensile Trading ChartPack to your StockCharts account, Click Here.
Trade well; trade with discipline!
– Gatis Roze, MBA, CMT
– Grayson Roze, VP of Operations, StockCharts.com
Co-Authors, Tensile Trading: The 10 Essential Stages of Stock Market Mastery (Wiley, 2016)
Co-Presenters, How To Master Your Asset Allocation Profile