I’m not a huge conspiracy theorist, but when it comes to Wall Street and all the TRILLIONS of dollars at stake, I believe anything goes! I especially love studying volatile periods. Are there signals out there to help us identify the REAL moves higher from the FAKE moves? As I study, I continue to learn, but I do believe we can gain valuable insight from spending time analyzing patterns.
In the move lower from the pre-pandemic February 19th high to the panicked low on March 23rd, the QQQ (ETF that tracks the NASDAQ 100) saw most of its move to the downside occurring at the opening bell. Here’s a spreadsheet that shows you the change each day during this period in the QQQ, breaking down how much of the drop occurred at the opening bell and how much was truly distribution (intraday selling – the change from the open to the close).
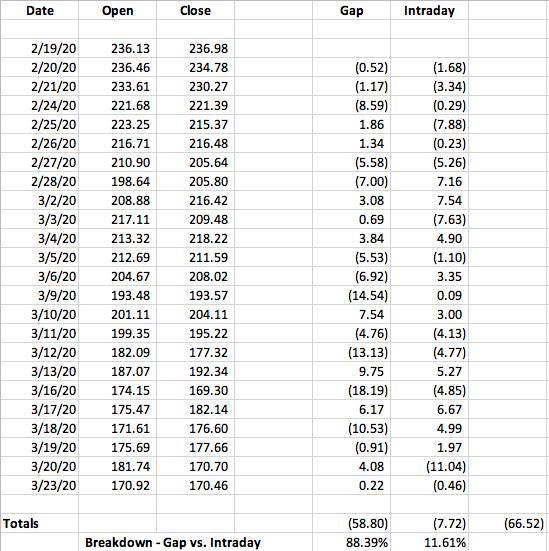
The QQQ fell from 236.98 to 170.46, a 66.52 drop, which is reflected in the far right column at the bottom. Net gaps were 58.80 LOWER, representing more than 88% of the decline. We only saw ACTUAL INTRADAY SELLING of 7.72 throughout the entire pandemic. In my humble opinion, the entire decline was media-induced panic. Wall Street wasn’t selling, they were more than happy to buy shares throughout the period. And we now know what happened in the rear view mirror. U.S. equities staged one of the most powerful rallies ever from that March 23rd low.
Now let’s fast forward to the January 2022 decline. The QQQ closed at 401.68 on January 3rd and at the close on January 23rd (the day before the major reversal), it closed at 351.69. Here’s the breakdown of gaps lower vs. intraday selling for those three weeks:
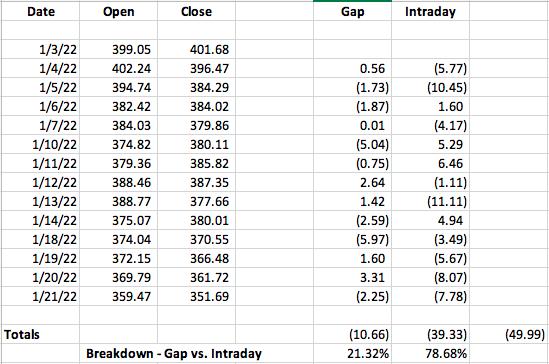
Hhhhhhmmmmmm. The picture has reversed. The selling in January was nearly 79% intraday vs. just 21% gaps. That, to me, looks like REAL distribution, which is a big reason why I wouldn’t trust this rebound.
Speaking of this rebound, what if we applied the same analysis? How much of the rebound through Thursday’s close was gap ups (orchestrated) vs. intraday buying (actual accumulation)?
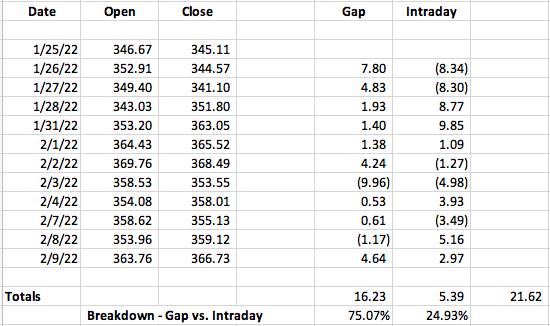
The “Big Rebound” was 75% orchestrated (gaps). The 25% true buying was likely retail investors, unaware of the manipulation taking place. Hey, maybe I’m wrong. Maybe the stock market will just come roaring back. But I’m not putting my money on it.
I believe we have more pain ahead, quite possibly a lot more pain. It’s the reason we announced our February Education Series that began last Saturday. This Saturday’s event, “The Anatomy of a Cyclical Bear Market” is designed to educate our members as to the likely duration and severity of the current cyclical bear market, which I think is now well underway. If you’d like to attend tomorrow’s event, you’ll need a 30-day free trial. For more information and to get your trial started, CLICK HERE. There’s never been a better time to be an EarningsBeats.com member!
Happy trading!
Tom