SPX Monitoring purposes: Neutral
Monitoring purposes GOLD: Long GDX on 6/8/20 at 32.79.
Long-Term Trend SPX monitor purposes: Short SPX 5/13/20 at 2820.
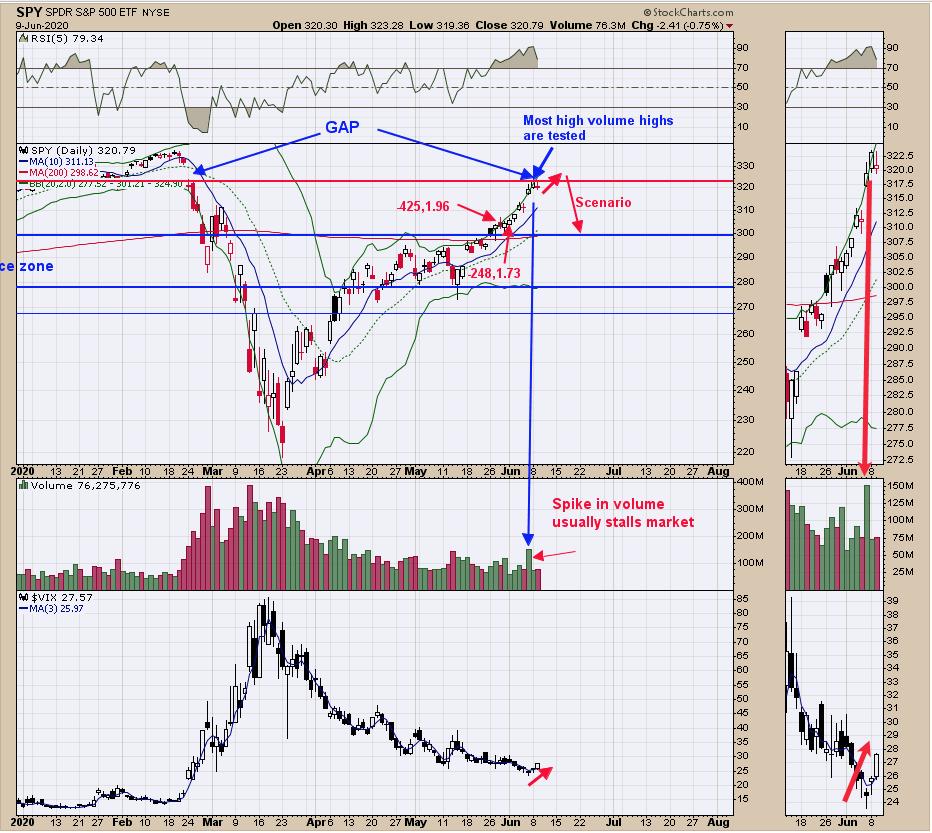
The SPY is running into the February gap, which is a natural resistance level. Friday’s volume increased nearly 50% from the days before, which usually leads to short-term exhaustion. Most high volume highs are tested again and, if the test comes on lighter volume, will be a bearish sign. If Friday’s high volume high is tested and tested on lighter volume along with that the VIX makes a higher low, a bearish picture will develop short term. The market may be heading to a consolidation. The NYSE did close above +600, suggesting a bullish condition longer-term. Sentiment is way to0 bullish short term, which also suggests consolidation. Our thinking is that the market may rest for the next 30 days before heading higher. A pullback to support near 300 on the spy is possible. Setup could form on a test of Friday’s high. Being patient for now.
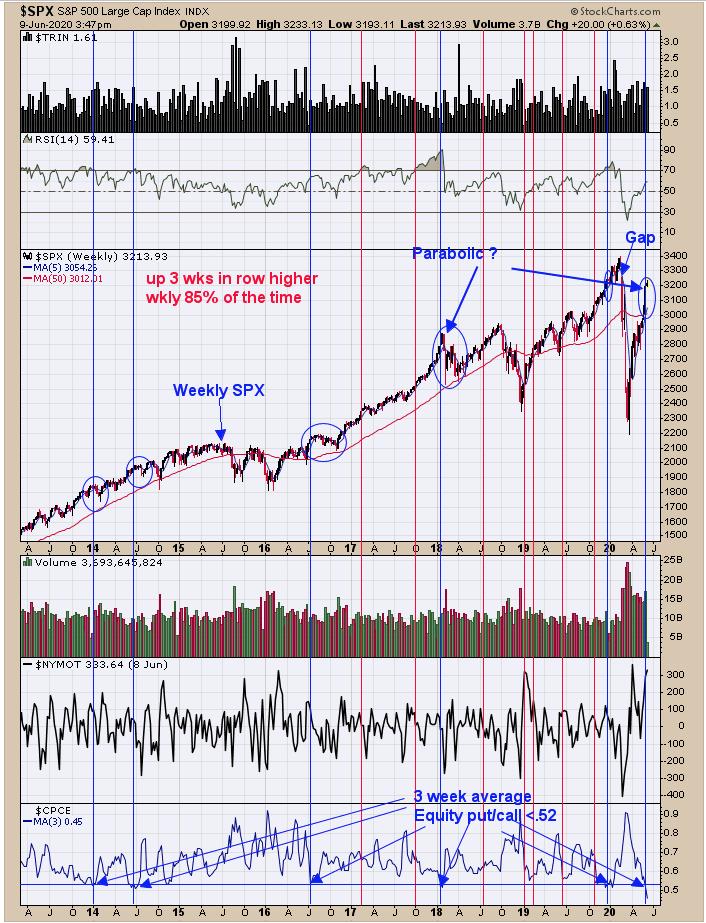
Yesterday, we said “fat-pitch.blogspot.com pointed out that when SPX is up three weeks in a row (vertical lines) the market is weekly higher 85% of the time. Add to that; when the three week Equity put/call reaches .52 (blue vertical lines) the upside is usually limited and a worthwhile correction forms in around a month. There is also a weekly gap near 325 on the SPY and market is testing that level now.” We updated this chart and noticed that, over the last week, the SPX may have gone parabolic. Back in early 2018, it also went parabolic and ended badly. The bottom window is the weekly three-period moving average of the Equity Put/Call, which moved to a new five-year low closing at .45. Momentum is still up, but the market is doing unusual things. Being patient for now.
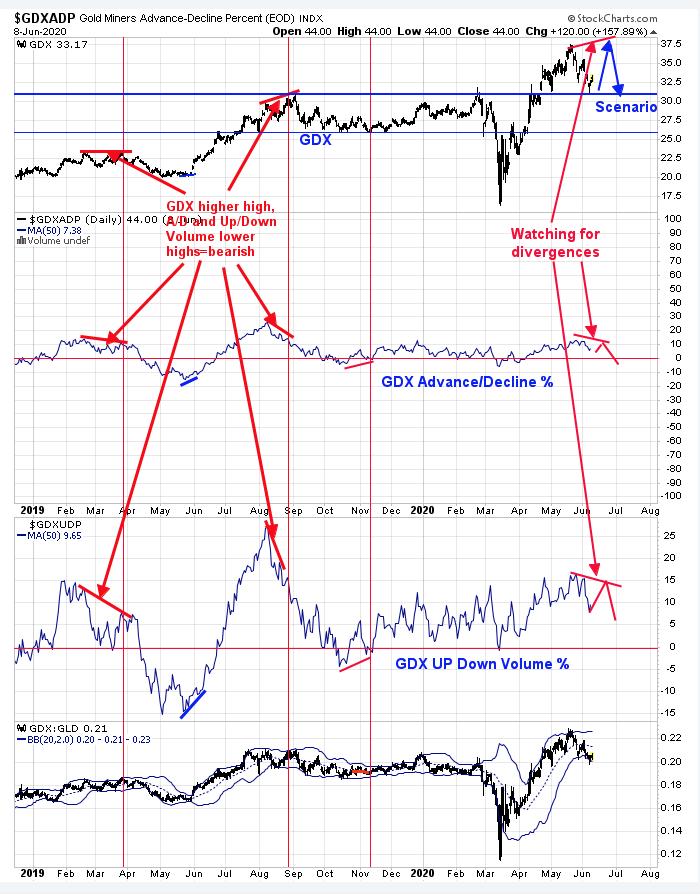
Here is an indicator that we will be looking at if indeed the GDX does rally to its previous high. The second and third windows up from the bottom are the Up Down volume and Advance/Decline indictors with a 50-day average. When GDX makes a higher high and then both indicators make a lower high, then a divergence is present, suggesting the GDX rally may be near an end. These divergences were present at the late March and early September 2019 highs. If GDX does manage to rally to a new short-term high and both indicators fail to reach a new short-term highs, that will suggests GDX is near a high. Long GDX on 6/8/20 at 32.79.
Tim Ord,
Editor
www.ord-oracle.com. New Book release “The Secret Science of Price and Volume” by Timothy Ord, buy at www.Amazon.com.