Weekly
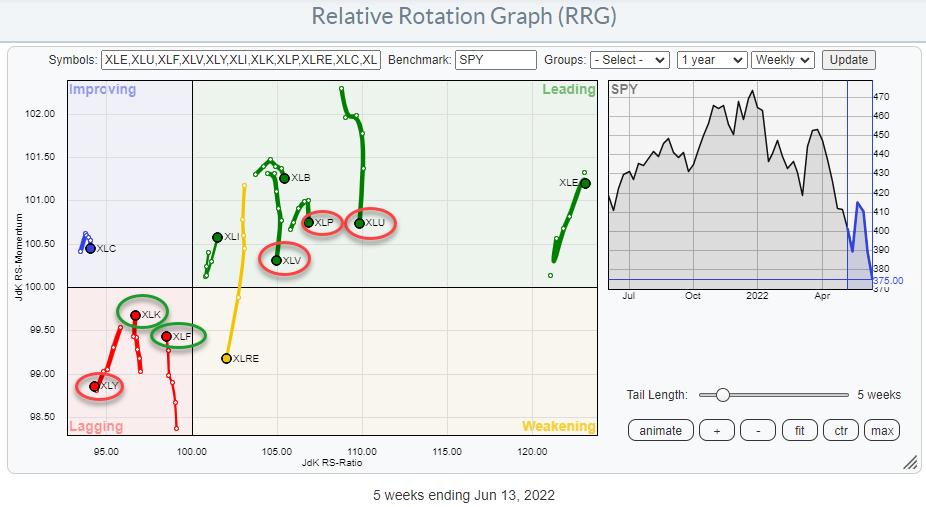
The Relative Rotation Graph for US sectors is arriving at an important juncture.
For months the defensive sectors have been the leading segment in the S&P, even before the peak was reached Utilities, Staples, and Healthcare started leading the market from a relative perspective. These sectors were the main driver in the last run of $SPX before its peak in the last week of December last year.
As the market started to decline going into 2022, these defensive sectors remained inside the leading quadrant on the RRG.
Only in January and February did the cyclical and sensitive (growth) sectors start to travel at a negative RRG-Heading, confirming the weakness in the general market.
The situation that is surfacing now is that the defensive sectors are moving lower while inside the leading quadrant while two out of three cyclical sectors are moving up inside the lagging quadrant.
First of all, this is NOT a change of trend or a turnaround (yet). Defense is still at the right-hand side of the RRG while offense is still on the left. SO the respective relative trends are still intact but losing, or gaining, relative momentum counter-trend.
Nevertheless, it is a move that should be watched closely as, theoretically, it could be the start of a rotation back to growth/cyclical sectors.
In order to gauge the odds for this to happen, or conclude that the current rotation, in slight favor of cyclical, is temporary in nature, we need to check the daily RRG which will show us a more granular image.
Defensive Daily
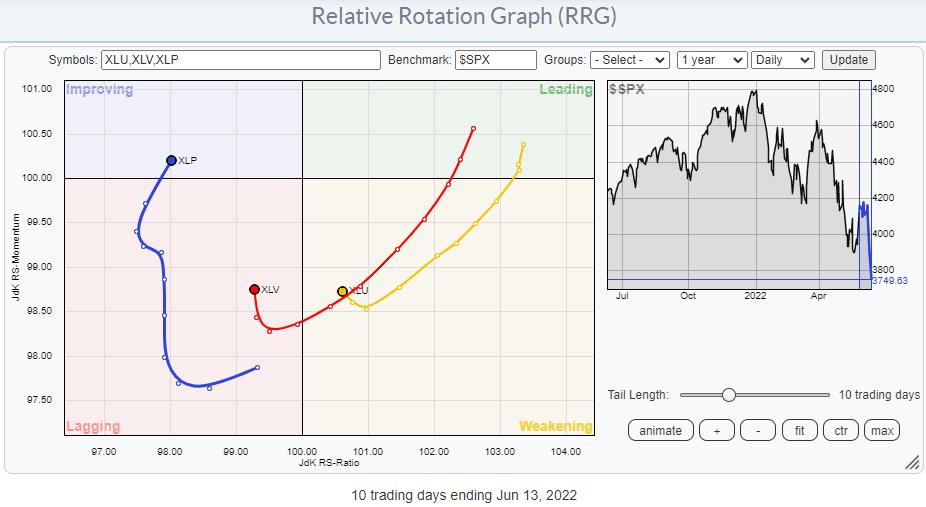
The rotation for the defensive sectors on the daily RRG has already started to turn back up. The tail for XLP has just turned back into the 0-90 RRG-Heading, XLV is close and XLU needs a bit more time but for all three the improvement is getting visible.
Maintaining this rotational trajectory will keep their weekly tails from deteriorating further and potentially cause them to turn back up again. It will depend on the strength of the rotation on the daily RRG if the weeklies need to go through weakening first or “hook” back up while they are still inside the leading quadrant.
Cyclical/Growth Daily
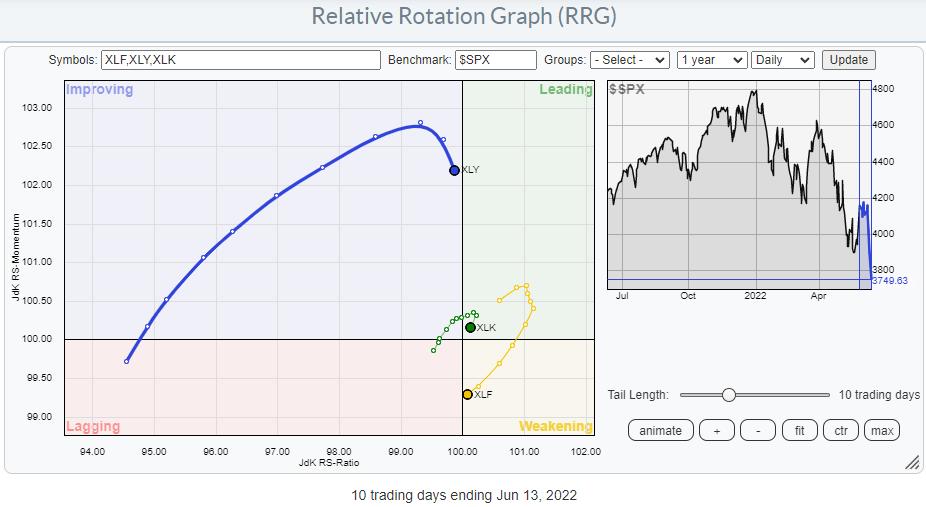
The daily RRG for XLF, XLK, and XLY is showing pretty much the opposite picture. All three are already rotating back to a negative RRG-Heading.
XLY is still inside the improving quadrant but the rotation is clearly visible. The sector might touch on the leading quadrant briefly but it is very unlikely to enter that quadrant with strength.
XLK has just turned back around and seems to be heading back towards the lagging quadrant while XLF made a wider turn but is showing a similar rotational pattern.
This means that these tails are now starting to add negative relative strength to the weekly tails, causing the opposite situation as described above for the defensive sectors.
All in all, the main takeaway is that defensive sectors remain in a primary (relative) downtrend while offensive sectors are in a primary (relative) uptrend. The recent rotation, which is still ongoing but seems to be turning around back in favor of defense again, is therefore judged as temporary.
Monitoring Breadth On Relative Rotation Graph
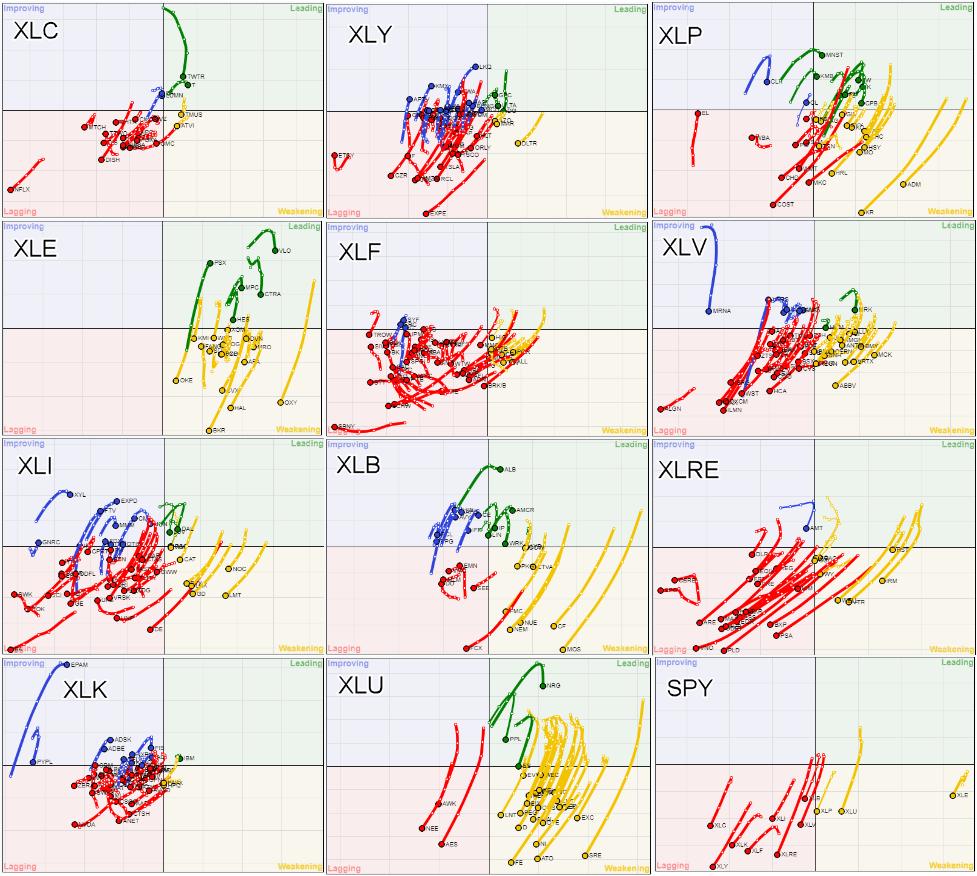
The image above shows 12 RRGs. One for each sector and one for all sectors against the S&P 500 (bottom right).
All these RRGs are using $ONE as the benchmark so they are measuring price trends instead of relative. Or stated otherwise they are measuring relative trends against a benchmark that never goes down.
The RRG for the sectors (SPY) in the bottom right shows clearly how the majority of sectors are currently in a downtrend and the few sectors left on the right-hand side of the graph are traveling at a negative RRG-Heading which means that their uptrends are losing power (momentum).
For the individual sectors, the RRGs show the rotations for the individual stocks inside each sector against $ONE. In most sectors, the majority of stocks are positioned inside the lagging quadrant and pushing further into it. Looking over all sector RRGs the dominant RRG-Heading is negative, between 180-270 degrees, which means that a massive loss of momentum is underway at the moment.
S&P 500
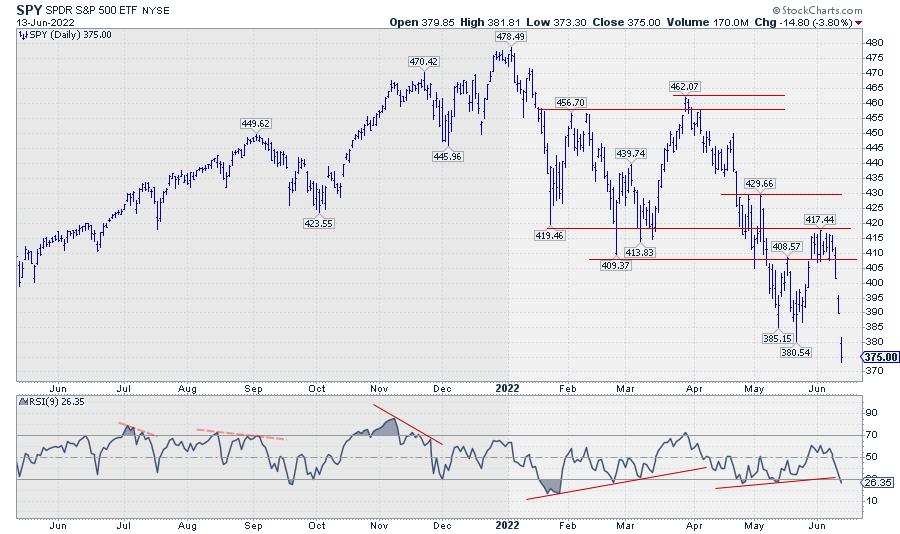
Combining all observations above it is very hard to see the S&P 500 turning back into a strong uptrend anytime soon. The two (runaway) gaps in the last few trading days and yesterday’s break below support at 380.50 are only adding to this view.
Remain very careful!!
#StaySafe, –Julius