
Some time ago, I started to play around with BETA as a metric to gauge risk appetite for sectors, then went from there to the general market. If you search for BETA in ChartSchool you will find this entry:
Beta:
A measure of a security’s systematic or market risk. While most stocks move in the same direction as the stock market, the level of the beta indicates the degree of correlation between a security and the market. The market is the benchmark and has a beta of 1.
A more explanatory article can be found at Investopedia: What BETA Means When Considering a Stock’s Risk.
Basically, it comes down to the interpretation of stocks, with a BETA > 1 being more volatile, and, in general, these are the stocks that do well in a rising market when investors usually have a bigger risk appetite. This is as opposed to stocks with BETA < 1, which are sought after when the market declines or uncertainty (=risk) hits the markets.
What we can do for individual stocks, we can also do for sectors. So what I did was set up a spreadsheet (drop me a message if you’d like a copy) that enables you to calculate the rolling BETA for all eleven sectors and rank them based on the results. When you play around with various periodicities, 12-month, 36-month, etc), you will find that the ranking changes. Thus, the the average volatility for sectors (and thus stocks) varies over time.
The most pronounced change that I have found is for the Technology sector.
60-Months
Here are the BETAs and the ranking for a 60-month period:
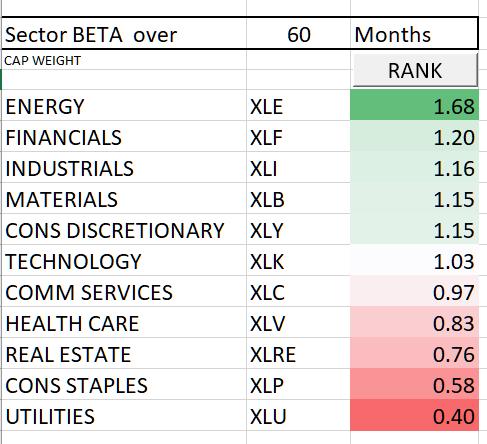
Technology is here just above 1, at 1.03.
36-Months
When we then switch to a 36-month period, the ranking looks like this:
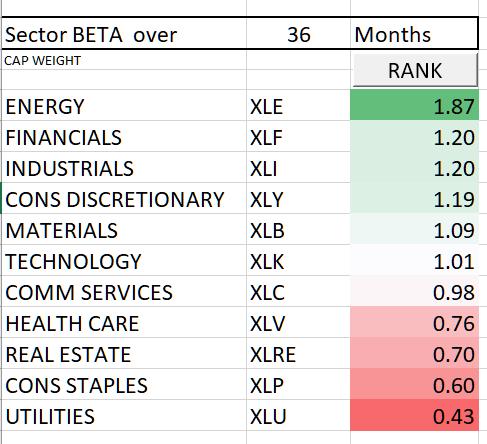
Tech has already come down to almost 1, at a 1.01 reading.
12-Months
At 12-months, this is what it looks like:
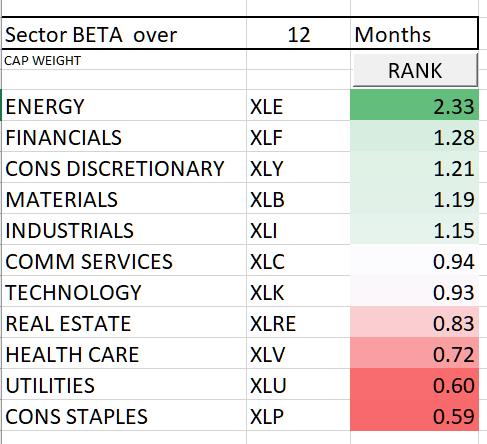
Technology has now dropped, significantly, below 1 at a reading of 0.93.
3-Months
But things get really interesting when you look at a 3-month period.
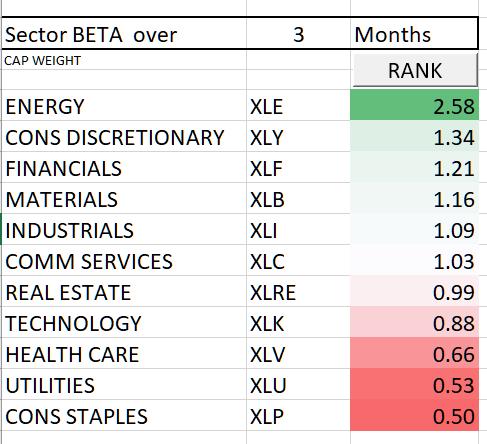
Technology is now down at 0.88, which puts it well inside the lower part of the ranking, just above the three traditionally (and widely accepted as such) defensive sectors. This observation led me to write this article: Technology Emerging as a Defensive Sector? Here are a Few Stocks to Watch.
Also, note how Real-Estate crawled up on the list with a 60-month BETA at 0.76 and 3-month at 0.99.
Ultimately, you want to look on how these BETAs for various periods evolve over time – that’s work in progress!
What About the Current Status?
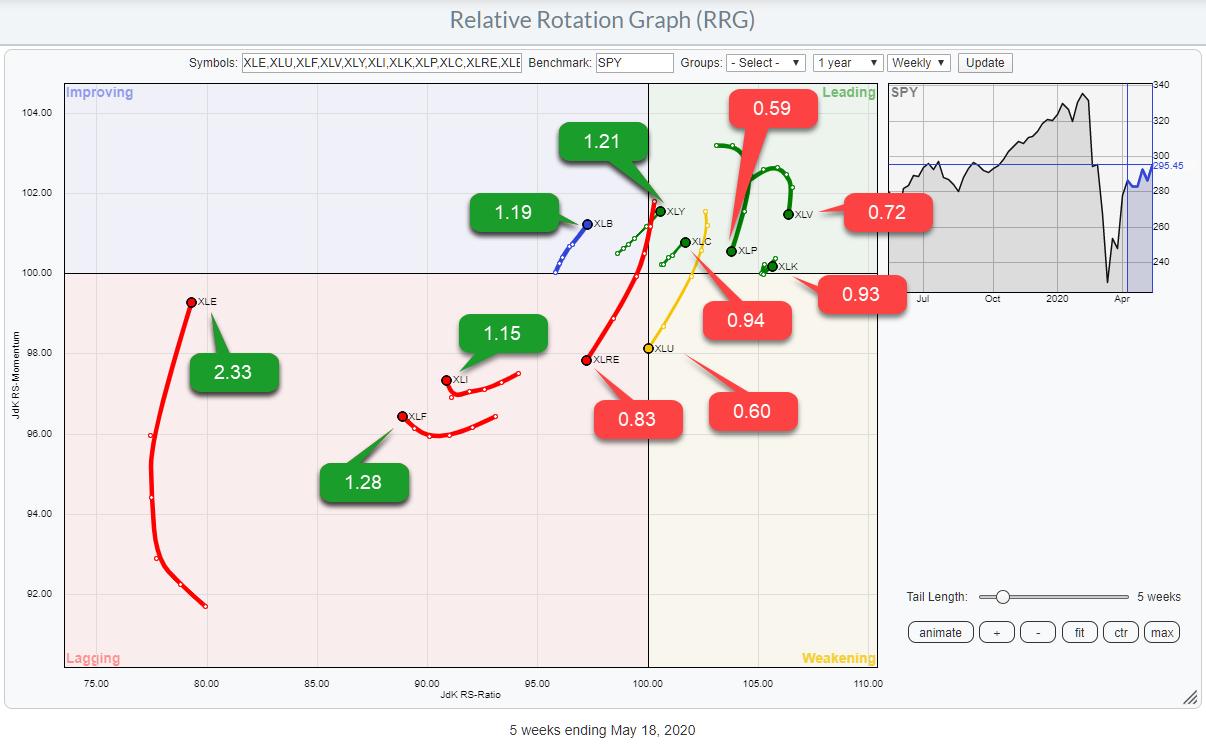
The current rotation on the Relative Rotation Graph shows the low (< 1) BETA sectors at the right side of the RRG and the high BETA sectors at the left hand side.
BUT… a change in rotation seems to be underway. The low BETA sectors are almost all rolling over or already heading lower at the JdK RS-Momentum scale and picking up negative movement on the JdK RS-Ratio scale, while the high-BETA sectors are curling up and starting to rotate to a positive RRG-Heading.
It’s the early stages, with the Energy sector in particular being very far away from crossing over to the right hand side, but the emerging rotation is definitely worth keeping an eye on.
Here’s what we get when we switch to the daily RRG with the same BETA labels:
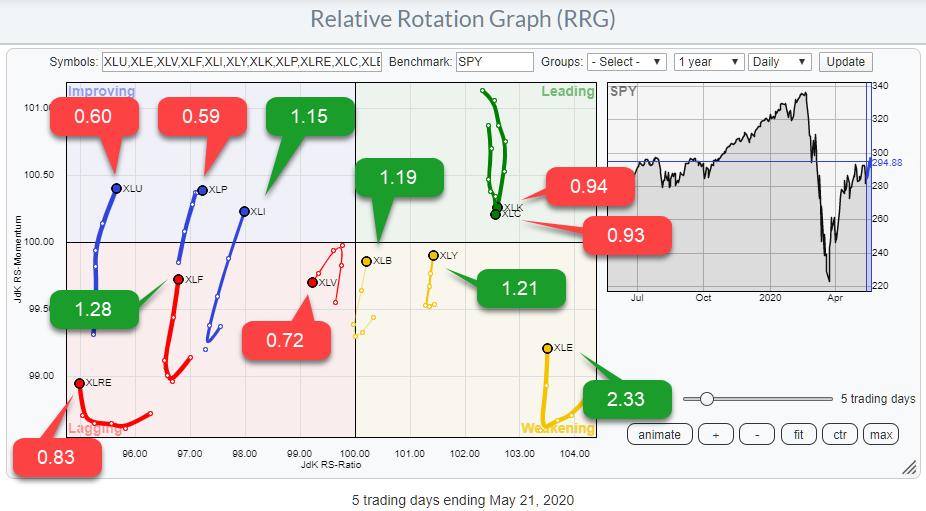
We can see that the sectors inside the weakening quadrant are all low BETA sectors, which have all curled up in the past week while XLK and XLC, both inside leading and low BETA, are rolling over.
It’s for sure not the holy grail, but (imho) it is worth keeping an eye on to see if it can help us gauge the direction of the general market ($SPX).
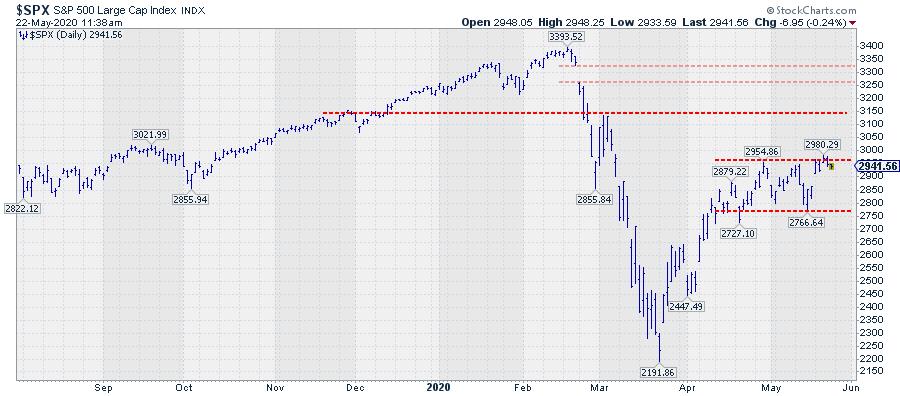
As always, the proof is in the pudding. For the time being, I am watching the recent trading range in $SPX, with the lower boundary at 2765 and the upper boundary at 2980. With the current emerging rotation in favor of high(er) BETA sectors, I am expecting an upward break out of that range, which will serve as the trigger for that rotation to continue.
The next level to watch after such a break would be 3150.
Here’s the video for this week’s Sector Spotlight, including the segment discussing the use of BETA for sectors.
Sector Spotlight #31 (5/19) segment on use of BETA (13:19)
Stay Tuned and #StaySafe,
–Julius
My regular blog is the RRG Charts blog. If you would like to receive a notification when a new article is published there, simply “Subscribe” with your email address.