Other key reports include the May ISM Manufacturing and non-manufacturing surveys, May Vehicle Sales and the Trade Deficit for April.
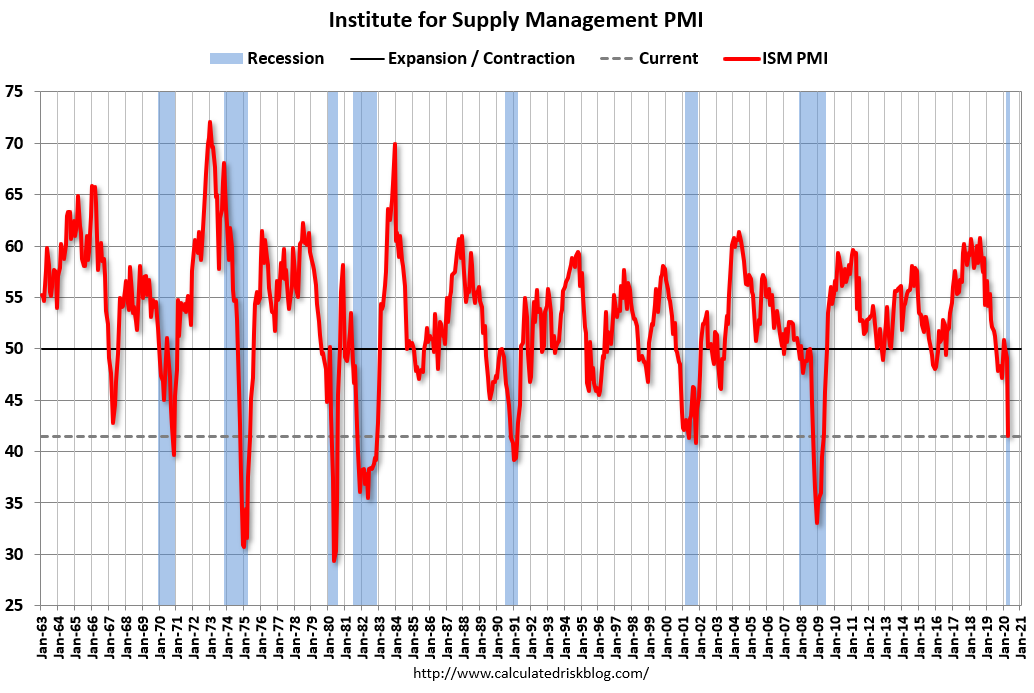 10:00 AM: ISM Manufacturing Index for May. The consensus is for the ISM to be at 43.0, up from 41.5 in April.
Here is a long term graph of the ISM manufacturing index.
The employment index was at 27.5% in April, and the new orders index was at 27.1%.
10:00 AM: Construction Spending for April. The consensus is for a 6.0% decrease in construction spending.
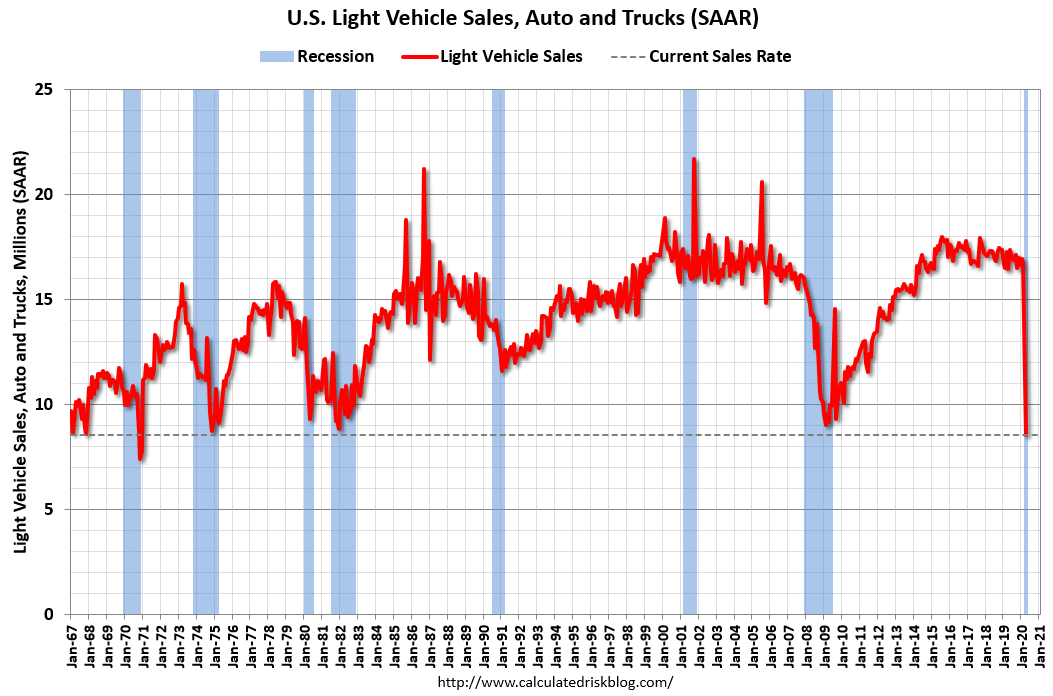 All day: Light vehicle sales for May. The consensus is for light vehicle sales to be 10.8 million SAAR in May, up from 8.6 million in April (Seasonally Adjusted Annual Rate).
This graph shows light vehicle sales since the BEA started keeping data in 1967. The dashed line is the sales rate for last month (lowest in 50 years).
10:00 AM: Corelogic House Price index for April.
7:00 AM ET: The Mortgage Bankers Association (MBA) will release the results for the mortgage purchase applications index.
8:15 AM: The ADP Employment Report for May. This report is for private payrolls only (no government). The consensus is for 9,000,000 payroll jobs lost in May, up from 20,236,000 lost in April.
10:00 AM: the ISM non-Manufacturing Index for May. The consensus is for a reading of 44.0, up from 41.8.
 8:30 AM: Trade Balance report for April from the Census Bureau.
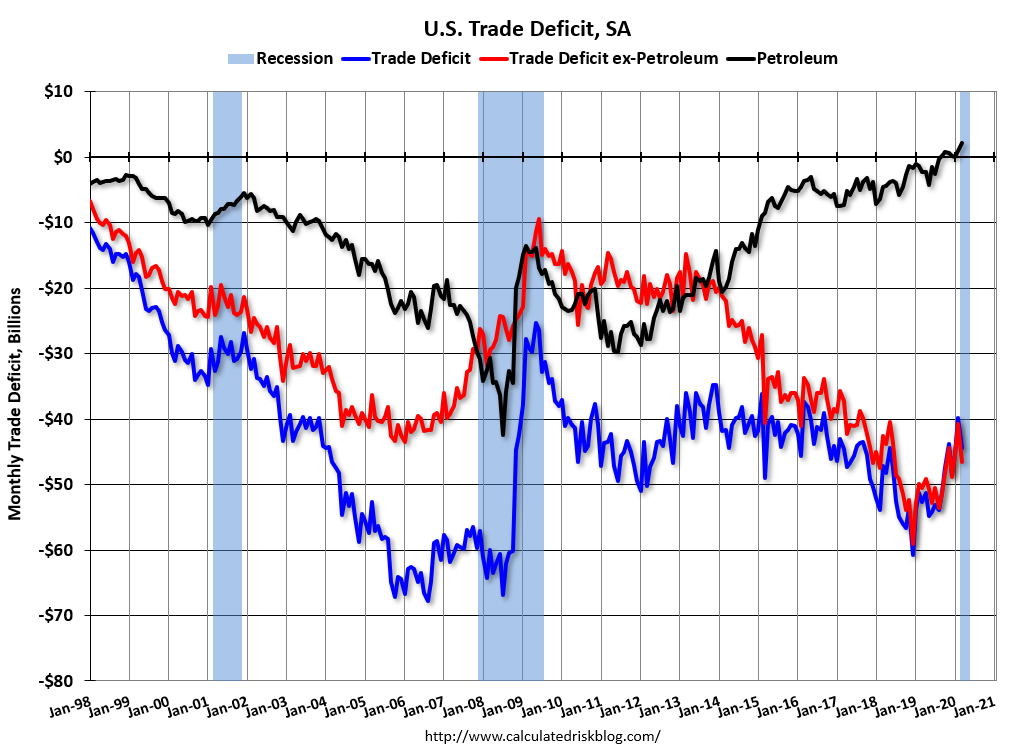
This graph shows the U.S. trade deficit, with and without petroleum, through the most recent report. The blue line is the total deficit, and the black line is the petroleum deficit, and the red line is the trade deficit ex-petroleum products.
The consensus is the trade deficit to be $44.3 billion. The U.S. trade deficit was at $44.4 Billion the previous month.
8:30 AM: The initial weekly unemployment claims report will be released. The consensus is for a 1.900 million initial claims, down from 2.123 million the previous week.
 8:30 AM: Employment Report for May. The consensus is for 8,250,000 jobs lost, and for the unemployment rate to increase to 19.7%.
There were 20,500,000 jobs lost in April, and the unemployment rate was at 14.7%.
This graph shows the job losses from the start of the employment recession, in percentage terms.
The current employment recession is by far the worst recession since WWII in percentage terms, and the worst in terms of the unemployment rate.