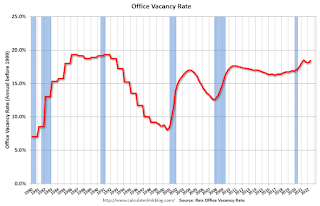
Given the intriguing supply and demand dynamics, office vacancy trended up 30 bps and finished the2nd quarter at 18.4%, merely 10 bps lower than its pandemic high in Q2 2021. On the rent front, both asking and effective rents edged up 0.4% during the quarter – these are the highest growth rates since the pandemic began. .
…
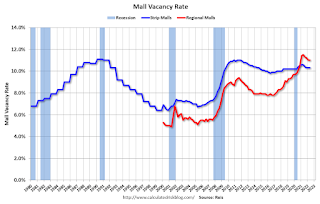
Our data shows the national vacancy for neighborhood and community shopping center has stayed flat at 10.3%, while asking rent is virtually unchanged and effective rent inched up 0.1% in the second quarter. Trend data on regional and super regional malls tells a similar story. Vacancy stayed flat at 11% and effective rent was up 0.1% this quarter.
emphasis added
 Click on graph for larger image.
This graph shows the office vacancy rate starting in 1980 (prior to 1999 the data is annual).
Reis reported that the vacancy rate for regional malls was 11.0% in Q2 2022, unchanged from 11.0% in Q1 2021, and down from 11.5% in Q2 2021. The regional mall vacancy rate peaked at 11.5% in Q2 2021.
For Neighborhood and Community malls (strip malls), the vacancy rate was 10.3% in Q2, unchanged from 10.3% in Q1, and down from 10.6% in Q2 2021. For strip malls, the vacancy rate peaked during the pandemic at 10.6% in both Q1 and Q2 2021.

In the mid-’00s, mall investment picked up as mall builders followed the “roof tops” of the residential boom (more loose lending). This led to the vacancy rate moving higher even before the recession started. Then there was a sharp increase in the vacancy rate during the recession and financial crisis.
In the last several years, even prior to the pandemic, the regional mall vacancy rates increased significantly from an already elevated level.