Every bull market cycle has its set of big, winning stocks – companies with strong fundamentals and increasing mutual fund sponsorship which helps propel these select stocks higher for huge gains. These leading names don’t go up forever however, and it’s important to know when to sell your stock – either to take profits or to keep your losses to a minimum.
Let’s review why a stock’s run might end. To begin, there may be a rotation away from the industry group or sector that your stock is a part of. Currently, we’re seeing a sharp rotation away from Technology and into “recovery” stocks that would benefit from increased vaccinations and a more mobile population.
Rotation alone doesn’t mean you should sell, however. Last week, Semiconductor stocks fell over 5%, yet there are select stocks in this group with very constructive charts. Subscribers to my MEM Edge Report are aware of these names as they remain on our Suggested Holdings List.
Broader market bias will also have a hand in whether you should ditch your stock and wait for better times, and it’s important to have a strong idea of where the market’s area of support is and whether it’s been broken.
DAILY CHART OF NASDAQ COMPOSITE INDEX ($COMPQ)
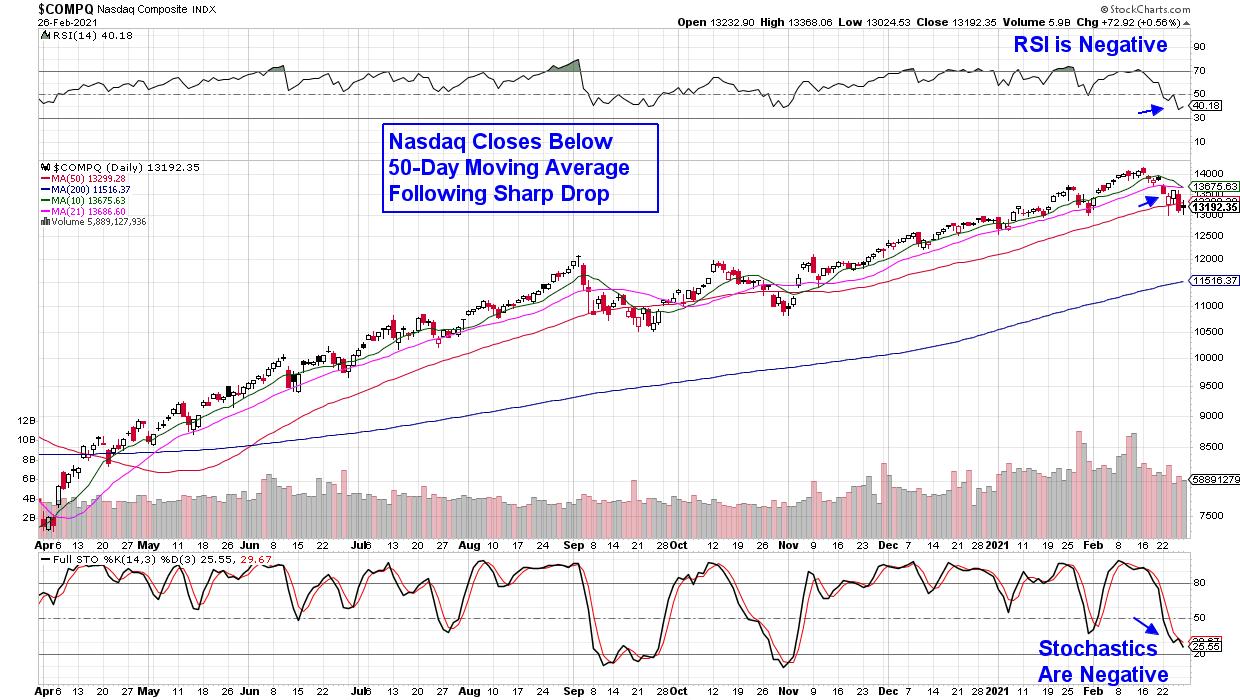
But when reviewing your individual holdings, you’ll want to be on the lookout for signs of heavy institutional selling which will be signaled by above average volume. Volume alone won’t tell the story, however. If the stock breaks below its 50-day moving average in heavy volume and can’t rally back above it by week’s end, it’s a signal that buying demand is drying up and the stock’s run may be ending.
These institutions can take weeks to unload their position, and it’s a good idea to sell your stock if it breaks below this key level as, historically speaking, more downside is likely ahead.
DAILY CHART OF COSTCO WHOLESALE CORP. (COST)
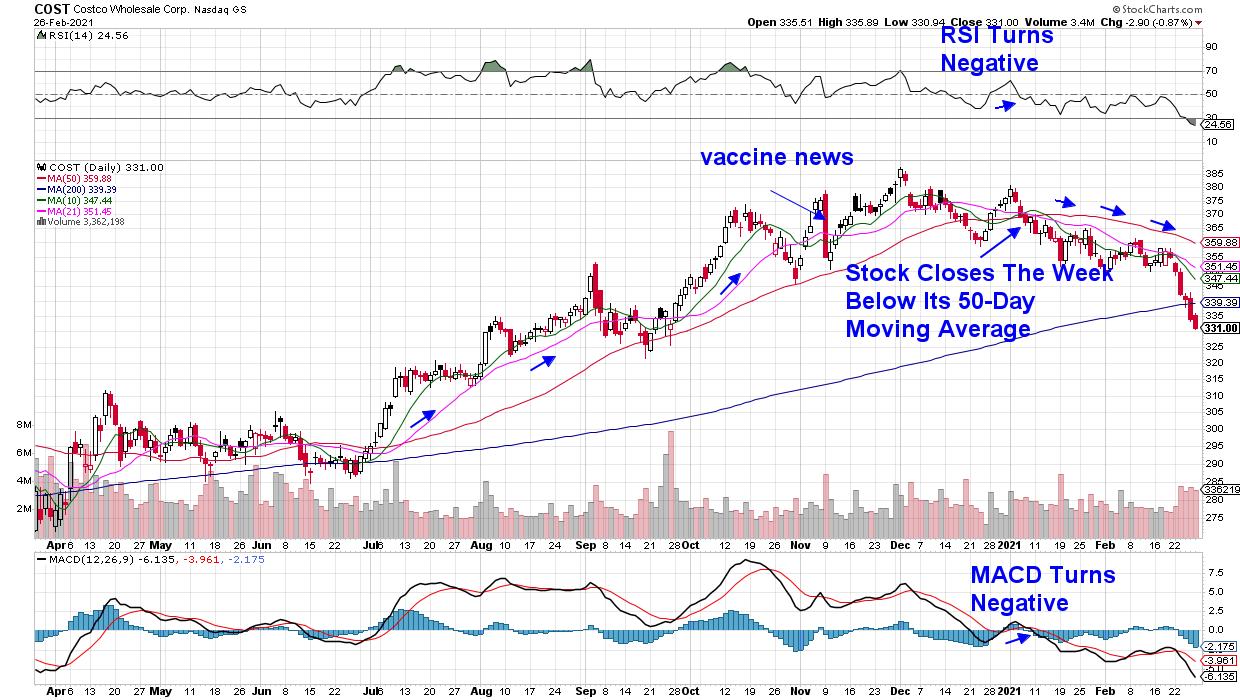
Above is a daily price chart of Costco (COST) and the stock was a big winner during mandated lockdowns that had people doing massive buying at one store both online and at Costco locations.
The first sign that investor’s may have shifted their high-growth outlook for the company came with a sharp drop on November 9th, when Pfizer announced their vaccine. The confirming signal that Costco’s run ended was its early January break below its key 50-day moving average (red line). Once the stock closes below this 50-day moving average, this moving average becomes upside resistance at lower and lower levels as the stock declines.
DAILY CHART OF QUALCOMM INC. (QCOM)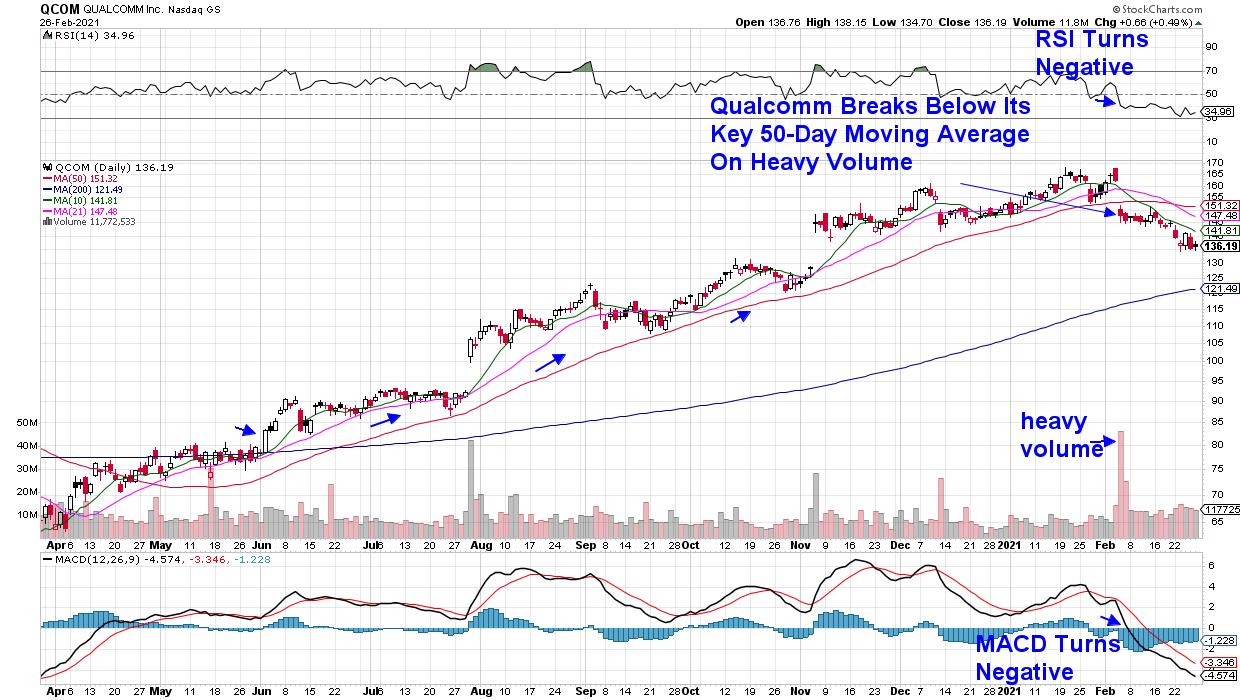
A more recent example is Qualcomm’s break below its key 50-day moving average on very heavy volume earlier this month. The move was following the company’s quarterly earnings results, which were positive; however, Wall Street had a mixed view of QCOM’s outlook going forward. Since that time, analysts have been revising their earnings estimates lower for both this year and next as capacity constraints may limit their revenue growth.
Both Costco (COST) and Qualcomm (QCOM) were big winners for subscribers to my MEM Edge Report before we removed them from our Suggested Holdings List after a break below their key 50-day moving average. Not all the news is negative out there, however, as many recovery stocks are currently in strong uptrends. Unlike Costco, most of these stocks rallied on the positive vaccine news in November, and they’re now breaking out of 14-week bases.
If you’d like to be kept up to date on whether it’s safe to buy new positions or whether the markets are headed lower, take a 4-week trial of my bi-weekly MEM Edge Report for a nominal fee. Last week, subscribers received Alert reports throughout the week advising them on the broader markets as well as select stocks.
Warmly,
Mary Ellen McGonagle