I recently tweeted the three steps for the S&P to signal a rotation from bullish phase to bearish phase, especially on the tactical time frame. After taking some time to digest this week’s distribution, I wanted to update that thesis with a four step “bull market top” signal for the Nasdaq.
While the news flow this week was all about rising interest rates, inflation concerns, Fed policy and stimulus debates, my focus as a technical analyst is trend. As a matter of fact, I am confident that investors should strive to have three goals at all times:
- Identify trends
- Follow those trends
- Anticipate when those trends may be exhausted
The fundamental, economic and geopolitical reasons as to why trends emerge usually appear very clear in the rearview mirror. Or, as a former colleague of mine always used to say, “The technical lead the fundamentals.”
When I look at the last year, it’s hard to find a better example of consistent outperformance than the Nasdaq Composite Index. This represents the types of “new economy” names that investors have been flocking to and sticking with during the recent bull market phase.
How do we anticipate when this long uptrend is exhausted? Well, the technical toolkit can really be separated into three buckets. Leading indicators, like RSI, are meant to signal before an inflection point and indicate an exhaustion of the previous trend. Concurrent indicators, like Fibonacci retracements and cycle analysis, attempt to identify specific price and time combinations of a turn. Lagging indicators, like moving averages, confirm once the trend has already reversed.
Let’s look at the chart of the Nasdaq Composite using a leading indicator like RSI.
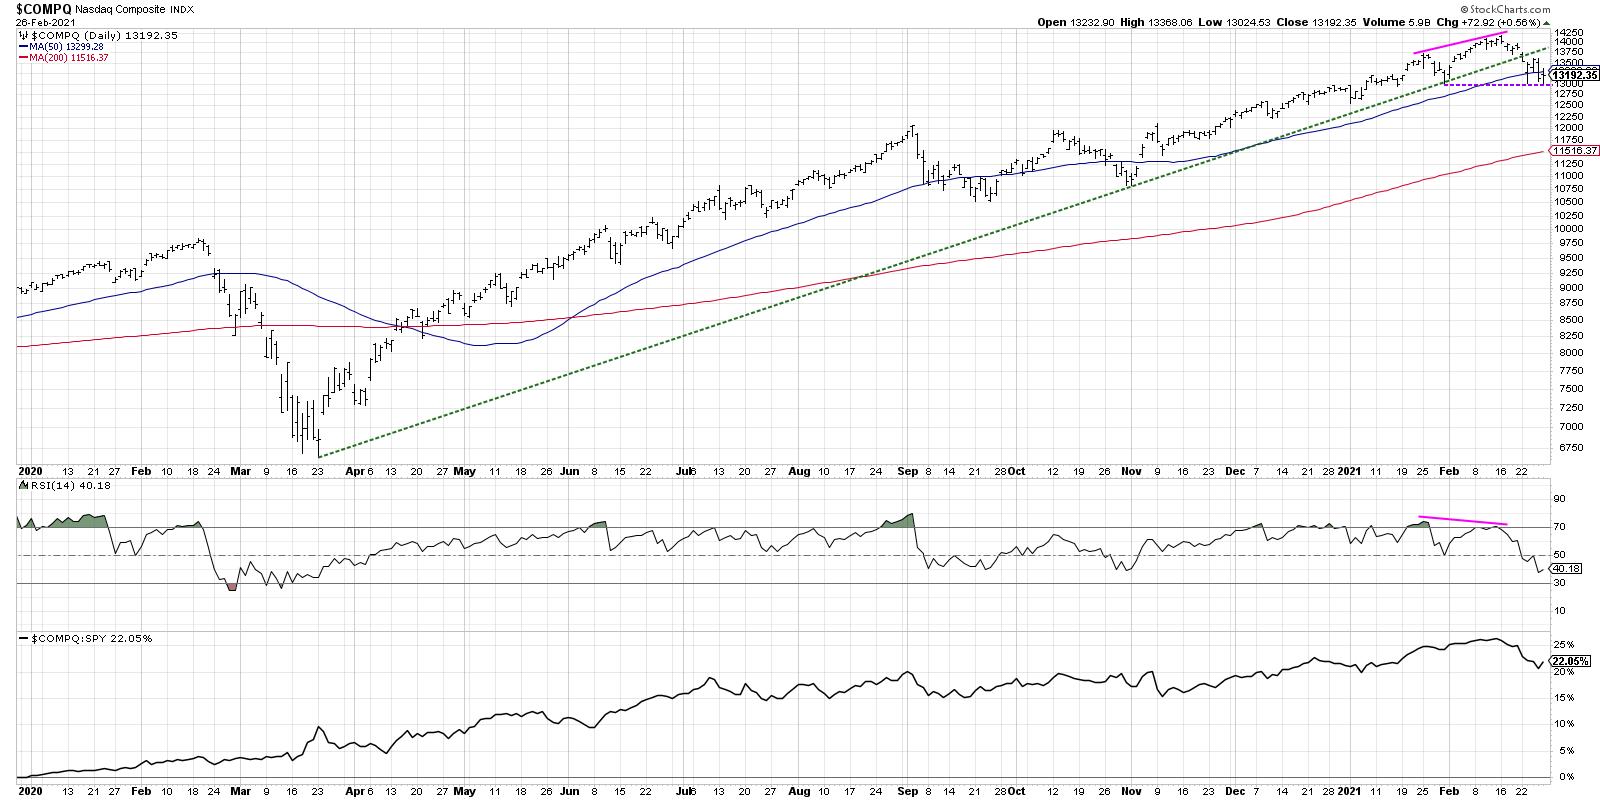
A healthy uptrend will show higher highs in price as well as higher highs in momentum. As the price moves ever higher, the RSI should continue to push higher as well. But, towards the end of a bullish trend, you’ll often see a bearish divergence, with higher prices and lower RSI.
The pink lines show the recent phenomenon where the January and February highs have increased, while the RSI is sloping downwards over the same period.
You may ask, “Did we get a bearish divergence like this in January and February 2020?” and the answer is, “Absolutely we did.”
Disclaimer: As with all technical indicators, this is not 100% effective. Look at June 2020 and you’ll find another example of higher prices and lower RSI. This is why a divergence is not a signal on its own in my process, but rather puts the chart on a watchlist for potential breakdown. Then it’s all about price itself and whether you see a downside follow through.
If we draw a trendline starting with the March low and connect it to the next major low in October, that connects beautifully with the late January low. Monday’s selloff pushed the Nasdaq below this trendline, which is the first of three price confirmations.
Next, we go to the 50-day moving average, which is a classic pullback opportunity. To put it another way, stocks in long-term uptrends often revert back to this smoothing mechanism in periods of short-term weakness. Many institutional investors use the 50-day moving average as a quick line-in-the-sand to determine whether a long-term uptrend will hold. Two of the five closes this week were indeed below the 50-day.
Finally, we have recent price support. As long as a chart is making higher highs and higher lows, the trend is positive by definition. A break to a new swing low indicates the uptrend is exhausted and confirms a new downtrend. This is the last step in the four steps, and the Nasdaq spent two days this week bouncing off this key support level.
So here’s the recap of the four steps in a classic bear market top, adapted to the current chart of the Nasdaq Composite.
- Bearish divergence with RSI (pink lines)? DONE.
- Price breaks through trendline support (green line)? DONE.
- Price breaks through 50-day moving average (blue line)? DONE.
- Price breaks through recent swing low (purple line)? Not yet.
The Nasdaq has triggered three of the four steps, with the last remaining step looming large as the markets reopen on Monday. I will certainly be watching to see if this final step is achieved, signaling a strong potential for further price weakness and rotation away from the long-term outperformance of the Nasdaq Composite.
RR#6,
Dave
David Keller, CMT
Chief Market Strategist
StockCharts.com
Disclaimer: This blog is for educational purposes only and should not be construed as financial advice. The ideas and strategies should never be used without first assessing your own personal and financial situation, or without consulting a financial professional.
The author does not have a position in mentioned securities at the time of publication. Any opinions expressed herein are solely those of the author and do not in any way represent the views or opinions of any other person or entity.