
The S&P 500 recently got back to positive territory for 2020, with a year-to-date return of 1.4% as of July 22nd. It didn’t stay positive for long though. Trading was down on the 23rd and 24th, bringing it back into negative territory as of the end of last week, with a year-to-date return of -0.47%. Getting back to positive for the year does not mean this bear market is over; however, as the S&P 500 is still down about 5% from its all-time high set on February 19th. Buy & hold investors have now spent more than five months either losing money or trying to recover from those losses. We’ll have to wait to see how much longer the recovery will take. As we mentioned in the last article, if the S&P 500 fully recovers anytime soon, it will be in the books for the shortest bear market in history. The current shortest bear market in the S&P 500 was from February 1966 to May 1967; that one lasted 14.8 months.
The outperformance of trend following, over a buy & hold approach to investing, is usually very apparent during and right after a bear market. One of trend following’s major benefits and source of outperformance comes from avoiding large losses. If bear markets didn’t exist, there would be less of a reason to use trend following; passive investing wouldn’t suffer devastating losses and could be tolerated by most investors. Of course, bear markets do exist, and occur with somewhat regular frequency. Since the 1960’s the S&P 500 has had a bear market about every 7 years on average. If you are investing in stocks over a 30-year or more timeframe, you should probably expect to face at least four bear markets. The bull market returns can be great for passive investors, but those bear markets sure won’t be any fun. Also, the timing of bear markets in your investment timeframe matters a lot. Bear markets when you are in or near your retirement are much worse, as we’ll illustrate below.
The problem with bear markets is not only the size of the losses – or drawdown from peak to trough – but also the amount of time it takes to recover from losses. The time that it takes for your investments to get back to even after a major drawdown event is a huge drag on your psyche and can of course be detrimental to investing plans. If you’re fortunate to still be in the accumulation phase (working/saving years) and you experience a 20% drawdown, academic finance will say to stay invested so you can fully recover as the market does. Being down 20% means you need a 25% gain just to get back to even. The problem with drawdowns is exacerbated if you are at or near retirement. A 20% drawdown on your account balance while you are withdrawing retirement income could take much more than a 25% gain to get back to even, and it is highly dependent on the duration of that drawdown.
Let’s look at the impact of retirement withdrawals (“w/d”) on different investments during this current bear market (which may end up being the shortest in history). Chart A shows the S&P 500 Index (100% stock portfolio) and the Vanguard Balanced Index Fund (VBINX) – a proxy for the common 60% stock and 40% bond portfolio.
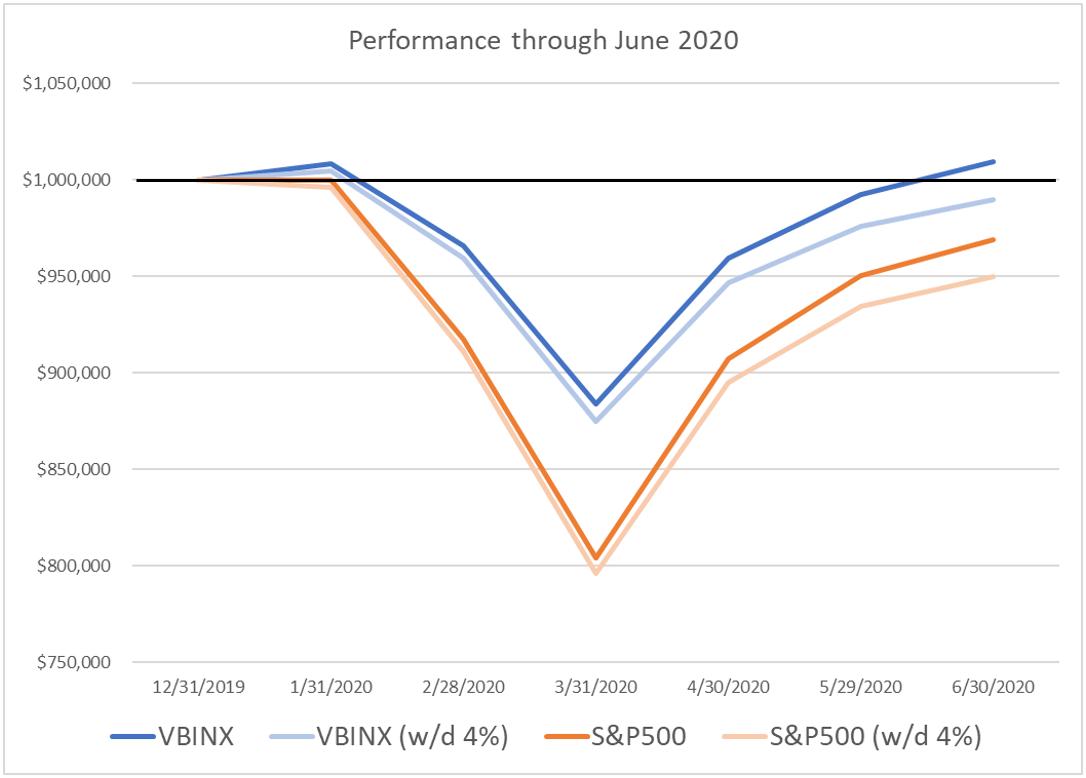
Chart A
The darker blue and orange lines reflect starting the year with a $1,000,000 buy and hold account in each investment. The lighter lines, denoted with “(w/d 4%)” in the legend, reflect the same investment accounts, but money has been withdrawn each month based on a 4% annual withdrawal rate, which is a common retirement withdrawal plan. The horizontal black line is at $1M. While the 60/40 portfolio has recovered to back over $1M, the VBINX account with withdrawals has not – and this is over a very short timeframe of just six months. The two S&P 500 accounts haven’t yet recovered and the one with withdrawals is of course furthest behind.
In longer bear markets, the impact of withdrawals is magnified. Chart B shows the 60/40 accounts starting with $1,000,000 at the end of 2006, both with and without withdrawals, going through the 2008 bear market and recovery.
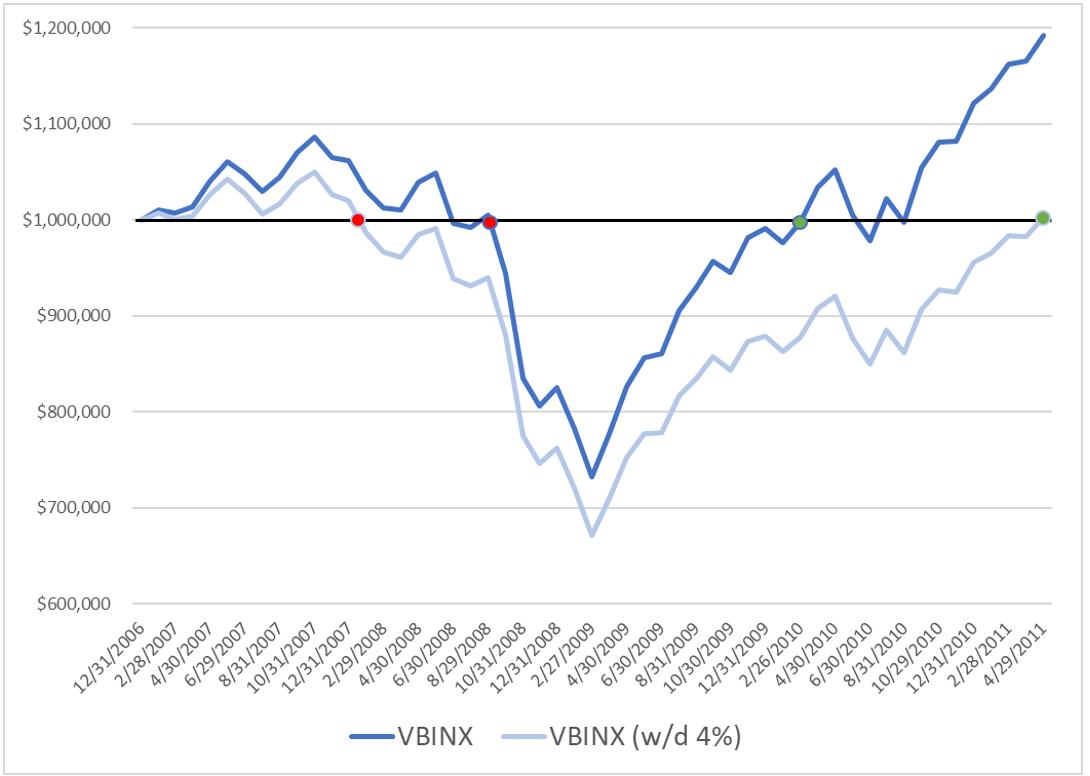
Chart B
The red dot on each line is the point prior to dipping below $1M and the green dot is when they recover to $1M. The period between the dots on VBINX was 19 months, while the period below $1M when you have withdrawals was 40 months – ouch! Withdrawing funds to live off of in retirement would have made your recovery take more than twice as long. If you were a 60/40 investor in retirement during this time period, you went more than 3 years without any portfolio growth, and you also saw the value of your portfolio drop 33% at its lowest point. Few retirees can withstand such devastating losses – most will quit while they’re down and never get the shot at recovering, maybe forcing them to drastically change their retirement plans – they may even have to come out of retirement.
Chart C shows the same for the S&P 500.
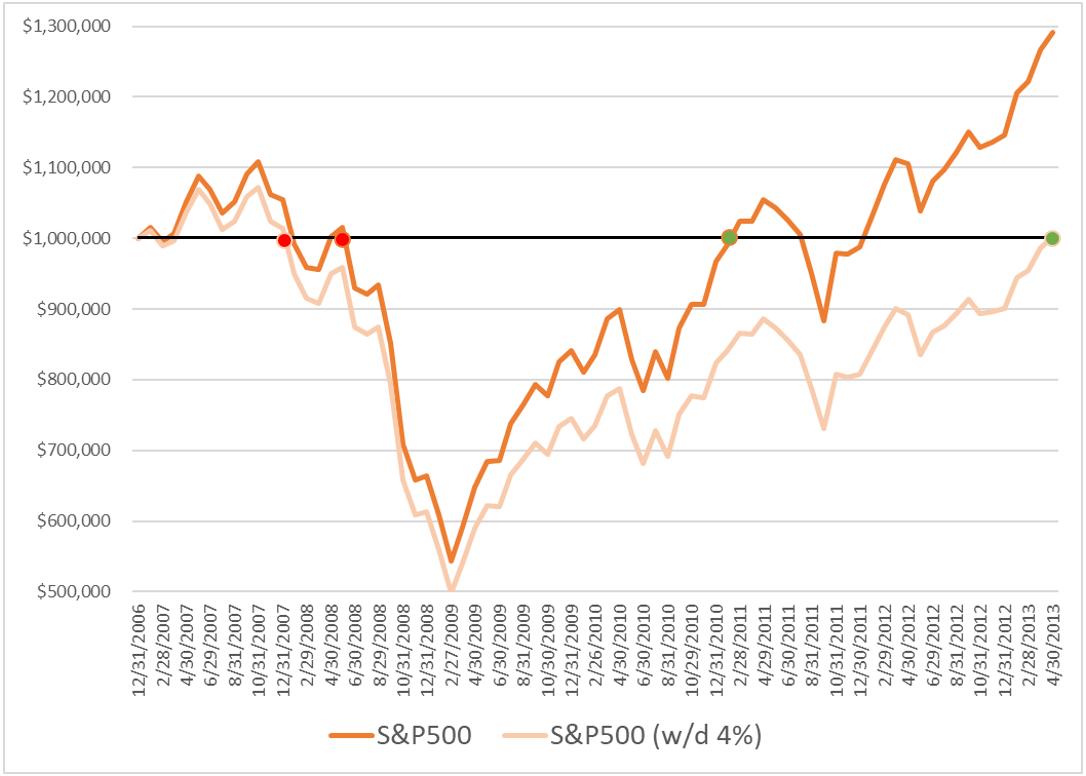
Chart C
The S&P 500 without withdrawals was below $1M for 33 months while the account taking monthly withdrawals took 64 months to recover (more than 5 years)!
Young investors may be able to tolerate such moves, but as you get older and your nest egg grows, it is much harder to do because the dollar values are so much more meaningful. Being down 20% on $1,000,000 (i.e., losing $200,000) feels a whole lot worse than being down 20% on $10,000 (losing $2,000).
We think a much better, more tolerable approach to investing when your nest egg becomes sizeable and your investment time horizon is shorter, is to use trend following. Trend following can be very powerful, as it will generally help to reduce the magnitude of your drawdowns and also the amount of time you spend in drawdown. This equates to more time making new money and higher compounded returns over time. It is also a great diversifier to traditional portfolios, as trend following rarely suffers underperformance at the same time a traditional portfolio is suffering losses. Below are the same three charts with the addition of our Trend Plus portfolio (Note that we always show modeled returns prior to 2017, as this exact strategy was not in use before that time).
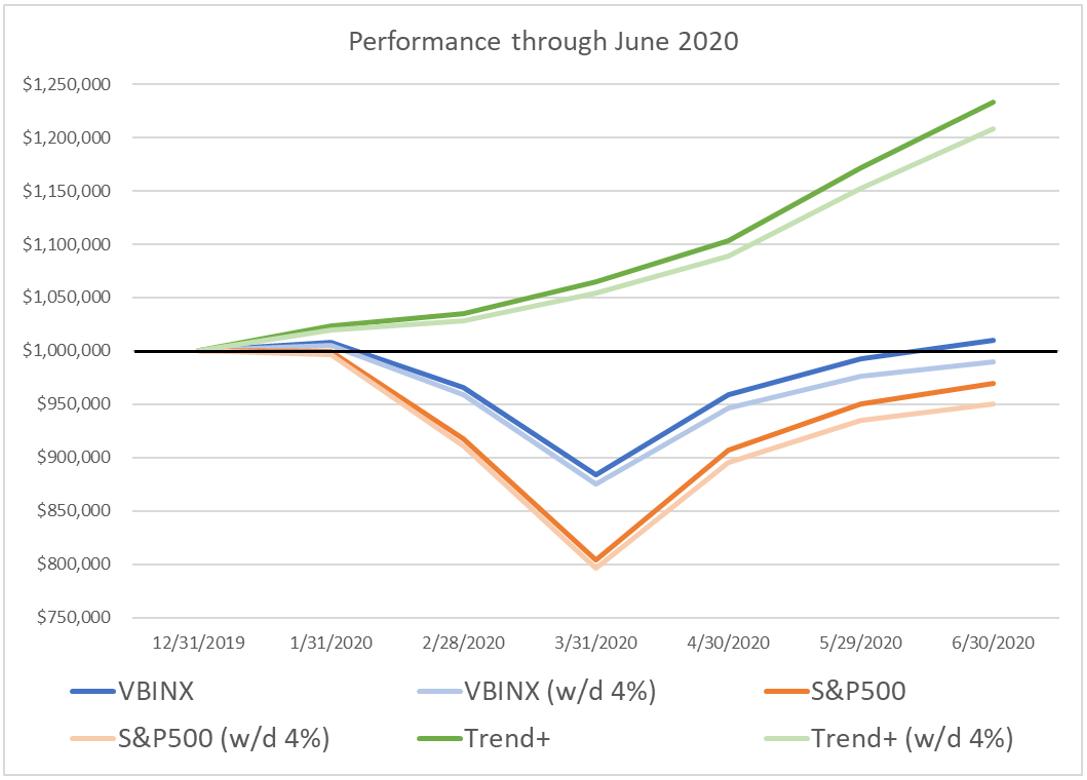
Chart D
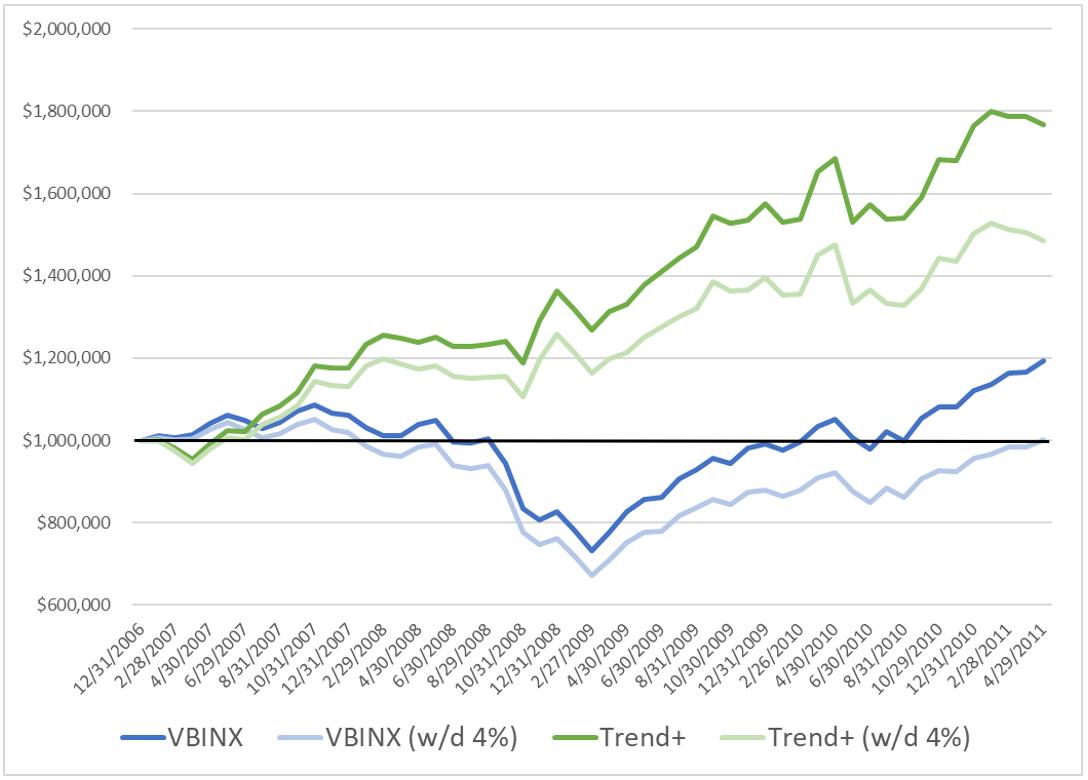
Chart E
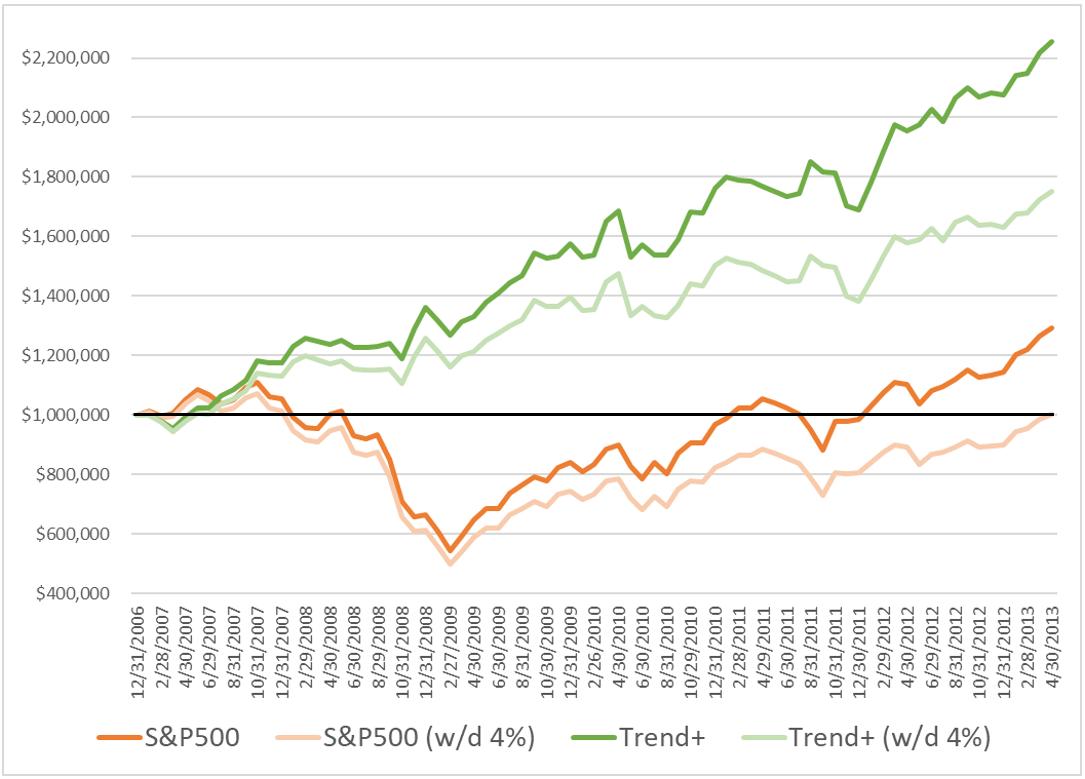
Chart F
Like we said before, the outperformance of trend following over a buy & hold approach is usually VERY apparent in bear markets. It sure has been this year, with buy & hold still trying to recover while our trend following approach is at highs, with positive returns each month. Trend following is a risk management approach more than anything else – it attempts to participate in market upside when it can, but always with a focus on downside protection. If you’ve been investing for a while and are tired of traditional approaches to handling bear markets, maybe it’s time for you to take a different approach to investing. Show the old bear a new trick.
If you are interested in incorporating trend following or tactical investment management into your investment plan, you can reach out to Grant directly by email (grant@mscm.net). Grant manages various tactical and trend following strategies at McElhenny Sheffield Capital Management for individual investors and other advisors, and Greg is a senior advisor to the firm.
Dance with the trend,
Greg Morris
Grant Morris