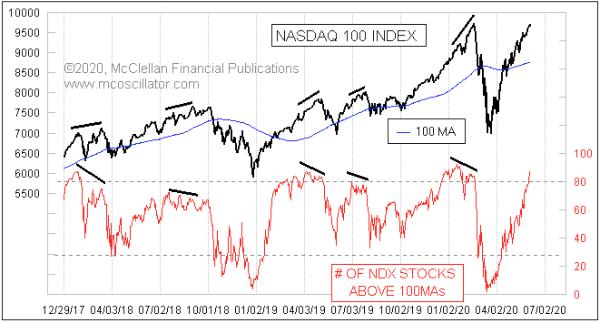
Chartists love to go looking for divergences of all types, because they can tell us ahead of time that a reversal for prices is coming. That can be fun information to get.
But divergences are problematic by nature. They can last for varying amounts of time before they finally “matter”. And sometimes they can get rehabilitated, with the divergent lower high being eclipsed by subsequent action. So just because you or I see a divergence in an indicator, that is no guarantee that it has to matter, nor that it has to “work” right at the moment when we see it.
This week’s chart is a great one for showing how divergences can matter. The indicator in the bottom of the chart measures the number of component stocks in the Nasdaq 100 which are above their own 100-day moving averages. When I first constructed the database to generate this indicator, I used 200 trading days as the lookback, thinking that it should be the best time period. It was okay, but, after some tinkering, I found that 100 days made for a better indicator.
This indicator gives great divergences at price tops that matter. So, for that attribute, it is a wonderful indicator. The duration of the divergences can vary, which is frustrating, but they all end up being proven to be “right” eventually. But an indicator which is right eventually is not necessarily what you want to follow for trading signals.
Because divergences pretty reliably appear in this indicator at important tops, it becomes very useful to observe when there is NOT a divergence. The absence of a divergence at an overbought reading tells you that the market is likely to NOT be at an important top, and that is the really useful information. Trending moves are where the big money is made, as opposed to timing the reversals. But how can one know that one is in a trending move? That is a really hard question, and the charts often do not give good answers to that question.
In this case, though, the absence of a divergent top at an overbought condition for this indicator is a pretty reliable sign that there is an intact uptrend and it is still underway. That is better information than what you get from a divergence, which has a message about maybe being at a reversal at some point. The lack of a divergence can tell you that it is okay to hang on and ride the trend for a while longer. What a wonderful message to get.
It is also worth noting that this indicator works differently at bottoms, where divergences generally do not appear. Up and down in the stock market are not the same.