I know I’m beating a dead horse, but rotation has been brutal, so timing key reversals in that rotation will be one key to trading success in 2022. Historically, when we compare NASDAQ performance vs. S&P 500 performance, there is a key threshold where we typically see NASDAQ underperformance. It’s usually best to see it visually, so let me get right to the chart:
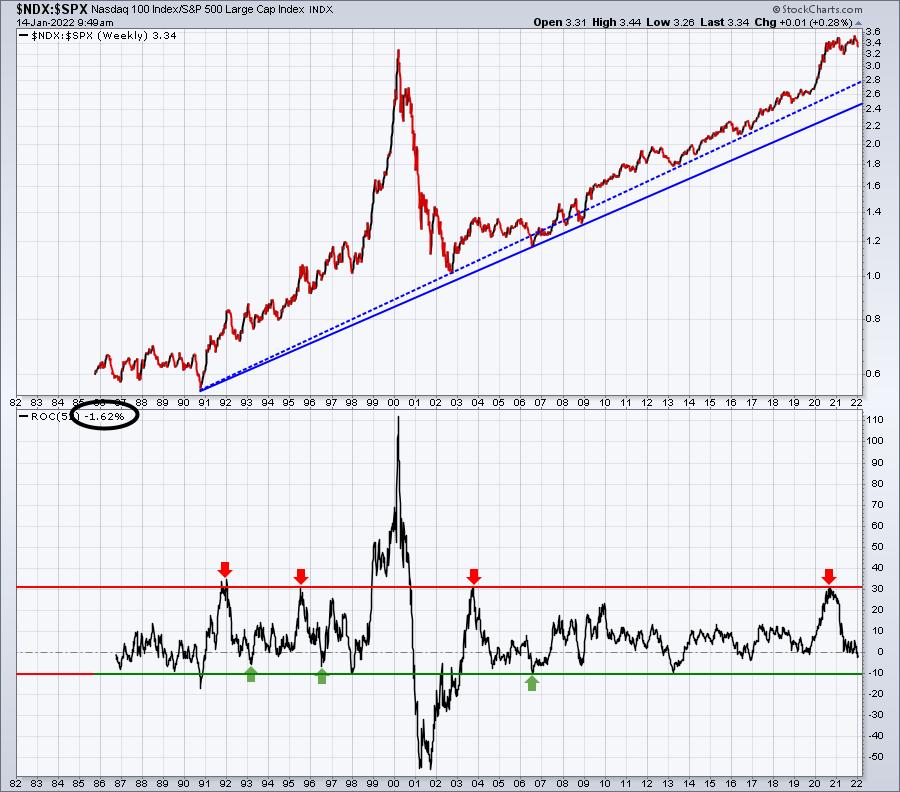
The top panel is simply the NASDAQ 100 Index ($NDX) divided by the S&P 500 Index ($SPX). This relative ratio ($NDX:$SPX) illustrates the overwhelmingly positive relative performance of the NDX over the past four decades. The dot-com bubble in the late 1990s resulted in an unsustainable surge in this ratio and you can see what happened subsequently. The COVID-19 pandemic created a similar relative surge and we’re now in the midst of a similar reversal, in my view. Outside of the dot-com era, any time the NDX outperforms the SPX by 30% over a 52-week period, that’s a serious warning sign for the next 1-2 years. In other words, we’ll be much more likely to see the S&P 500 outperform next. We’re experiencing that right now.
That bottom panel is the rate of change for 52 periods. Well, it’s a weekly chart, so the rate of change is for 52 weeks, or one year. With only two exceptions, the NASDAQ underperformance typically peaks at -10%. Currently, we’re at -1.62% (black circle). There’s certainly more room to fall and the threat of higher inflation and higher interest rates could drive us to that -10% level. Because of the very unusual reason (COVID) for the relative surge higher, I think it’s possible that perhaps we’ll see this -10% reversal area breached. Maybe we get to -12% to -15%. But if we do get to that level, that would be a historical signal to overweight the NASDAQ, which means growth stocks would likely return to favor.
Speaking of growth stocks, you may have heard of this company called Apple (AAPL). I saw a startling seasonal stat that I’ll be featuring in Monday’s EB Digest. This is our FREE newsletter (no credit card required) that’s published 3x per week on Mondays, Wednesdays, and Fridays, typically an hour or so before the market opens. I view it as an educational newsletter designed to introduce you to EarningsBeats.com and our trading philosophy and strategies. If you’d like to receive this seasonal tidbit on AAPL on Monday, simply CLICK HERE and enter your name and email address.
Happy trading!
Tom