Trend Plus
Our Trend Plus strategy delivered a net return after fees of 1.6% during 2021, while a 60/40 portfolio was up about 14% and the S&P 500 was up 26.9%. Underperforming the broad market or benchmark portfolios can be very frustrating to investors, but as we’ve said many times in this blog, it is better to deal with frustration then devastation. Devastation comes from watching your capital evaporate during a bear market, panic selling after the damage has been done, and then not being able to participate in the eventual recovery out of fear that more losses could occur. The Buy & Hold approach is truly devastating at times to investor’s confidence and their retirement plans.
The frustration of our chosen investment approach can somewhat be mitigated by examining the goals of the strategy and whether those goals continue to be met. We are never focused on outperforming the broad market or other benchmarks in a specific time period like months, quarters, or calendar years. The primary goal (#1) of our strategy is to deliver good returns over time, especially over full market cycles, while avoiding the large losses that are seen in bear markets.
Our other goals are to (#2) deliver higher risk-adjusted returns than the S&P or reasonable benchmarks and to (#3) beat the S&P500 over full market cycles. A full market cycle includes a bull market and a bear market. You have to include a bear market in the comparison to the S&P or it is not a reasonable comparison, since most tactical strategies like ours deliver a significant amount of outperformance when they avoid the damage of bear markets. That cannot be overlooked. Of course, if you think we won’t have any more bear markets in the U.S. you might as well stop reading now, and good luck to you!
Related to goal #1 is that we want to invest in a way that never causes a client to panic sell for suffering large losses. Advisors that use the Buy & Hold approach to investing will put their clients in that situation multiple times throughout their careers. We avoid that scenario by focusing on risk management and downside protection.
Below is a chart of the Nasdaq Composite index for the year, shaded green when Trend Plus was invested and red when Trend Plus was defensive. The Nasdaq was up 21.4% during the year. The blue lines break the year into quarters and the net return of Trend Plus is shown for each period. From this chart you can see our model getting invested after an uptrend begins, only to be stopped out (sometimes quickly) when the market pulled back. Losing money in defensive positions during Q1 and multiple whipsaw trades in Q3 attributed to most of the underperformance.
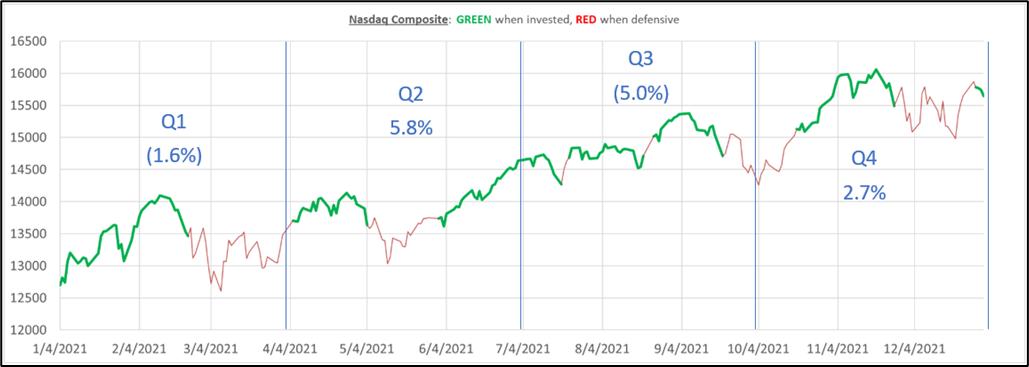
Many will look at the year-end number of the major index returns and conclude that the market moved straight up all year. This was definitely not the case. The Nasdaq had several pullbacks between 6-8% and was in a full correction, down more than 10%, in March (shown below).
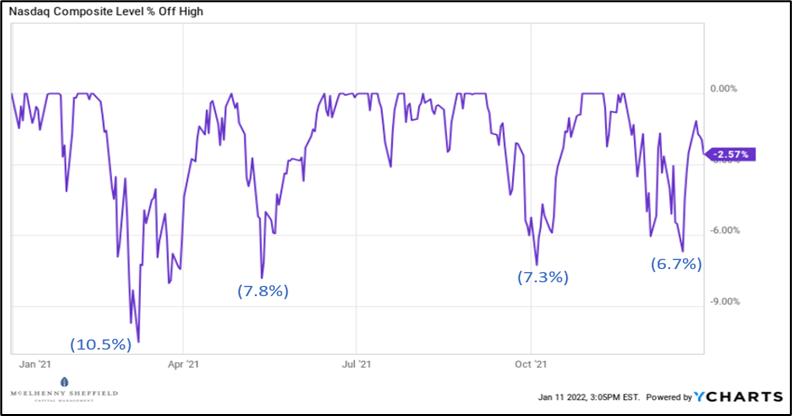
Trend following works best when the market trends, and during 2021 the market never had a sustained uptrend (or downtrend, for that matter). Thankfully, we know from our research that the U.S. equity markets do exhibit many periods of trend and our belief is that our strategy will be able to capitalize on those periods, all while avoiding major drawdowns.
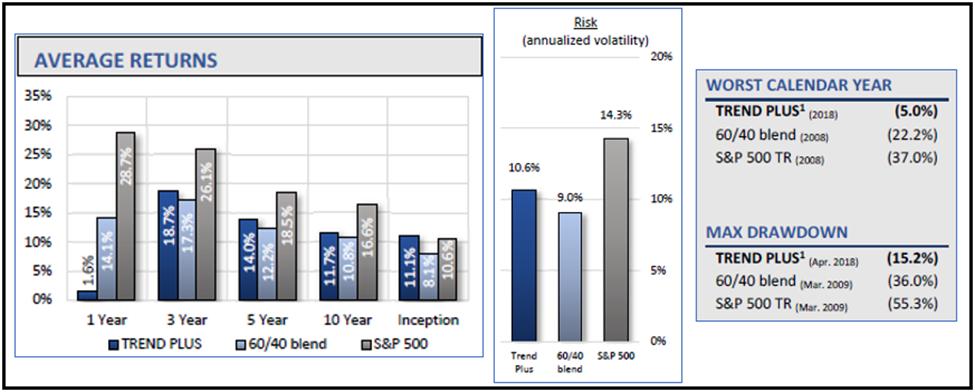
Looking beyond just the one year allows us to see if we are still achieving our goals in terms of returns. Over the three-year period, Trend Plus has had average annual returns of 18.7%, versus the 60/40 portfolio of 17.3%, and over the five-year period of 14% versus the 60/40 portfolio of 12.2%. Keep in mind that the three-year and five-year periods take into account the underperformance of 2021. The 60/40 is a more appropriate benchmark based on the risk of our strategy.
Trend Plus Metrics:
Sometimes a single strategy is hard to stick with even if it is meeting the stated goals, because it is hard for investors to not compare it to the S&P and they often get frustrated if the relative performance to the S&P lags by a lot. Investors often chase returns and may go elsewhere when they see a strategy underperform. No strategy or investing approach can beat the S&P500 over every timeframe…that seems to be what people expect, but it doesn’t exist. That is why at MSCM, we typically incorporate at least two distinct tactical investment strategies in client accounts to help offset the periods where any given strategy may underperform. This is just another form of diversification – diversifying by strategy type as opposed to just by asset class and geography.
Sector Rotation
The second main tactical strategy that we run is called Sector Rotation and it is a momentum strategy that invests in the top three ETFs from our investment universe, based on our proprietary momentum ranking criteria. Our universe of ETFs covers the main S&P sectors, plus some ETFs to provide sub-sector/industry exposure in market segments that may behave differently than their sectors, and a few broad market ETFs. The strategy allocates 40% to the top ranked ETF and 30% each to the second and third ranked ETFs. Positions always have stop loss protection and we use a longer timeframe signal to move the whole strategy defensive when the chance of a bear market is high.
The strategy is 100% rules-based and fully tactical, meaning that we don’t continue to use momentum to score ETFs when it looks like the market is in a downtrend. Using momentum when the stock market is going down just means you are buying what is going down the least…likely the more defensive sectors (utilities, consumer staples, etc.). We don’t want to own what is going down and would rather move to defensive non-equity positions (gold, treasuries, U.S. dollar) that have a chance of appreciating during a market selloff.
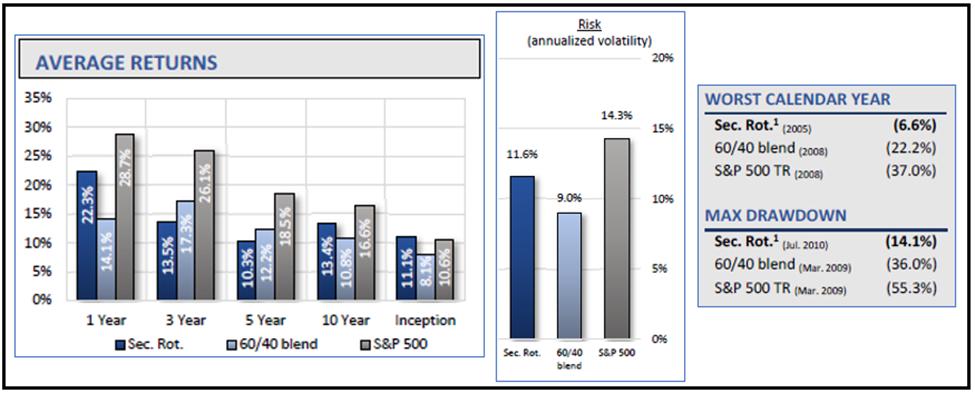
Sector Rotation was built independently of Trend Plus; it is trying to take advantage of a different market factor and uses entirely different indicators and rules. The strategy has positive expected returns and delivers very similar risk and return metrics as Trend Plus.
Sector Rotation Metrics:
The good thing about having both of these models available to run in a single account is they have a low correlation to each other, so investors receive a huge diversification benefit by allocating to both. When one strategy is underperforming the other strategy is usually doing just fine, and vice versa. We think the combination of both strategies can handle just about any market environment and work to deliver a smoother investment path for clients.
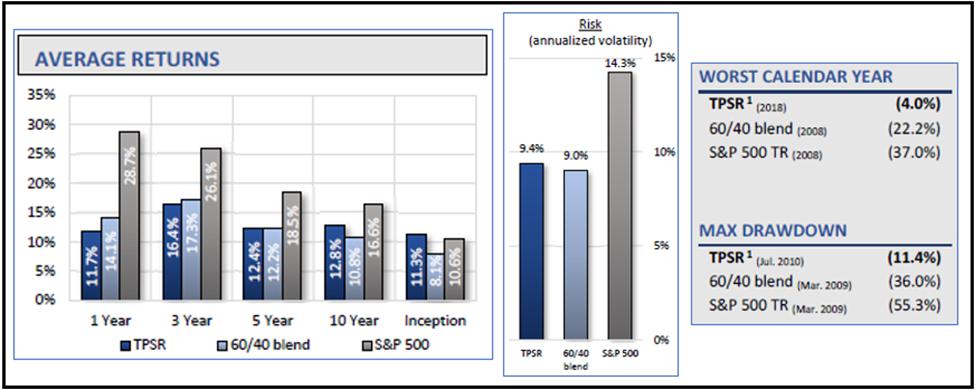
TPSR
In fact, we have a strategy called TPSR that is a 50% allocation to Trend Plus and a 50% allocation to Sector Rotation. The TPSR approach delivers an even better risk adjusted return than either strategy on its own (this is the diversification benefit). The TPSR strategy also has a low correlation to traditional/non-tactical portfolios such as those built with strategic asset allocations. During bear markets, TPSR often has a negative correlation to those traditional portfolios, providing true uncorrelated returns and diversification to the investors.
TPSR Metrics:
We even recently launched an ETF based on this blended strategy. One of the biggest benefits of having the strategy in an ETF wrapper is that investors can buy the ETF and own it long term and it should be more tax efficient than allocating to the strategies in separately managed accounts, since the ETF can avoid passing through most capital gains. An investor owning the ETF might only realize gains when they sell a share of the ETF. If they own the ETF for more than 12 months, those gains are likely taxed at the more favorable rate as long-term capital gains. An investor not needing liquidity might defer most taxable gains indefinitely. We think the ETF will be a great way for investors and advisors with traditional portfolios to add additional diversification into tactical strategies and improve their investment outcomes.
If you want to learn more about our tactical strategies or the new ETF, please go to www.mscm.net.
Dance with the Trend,
Greg Morris
Grant Morris