
On Friday, three of the major indices gapped lower, ultimately closing negative for the week. The Russell 2000, although down on Friday, closed up on the week.
With the media pointing to a slew of reasons for the price drop, like negative bank earnings, slow vaccination rates, fall in retail sales, rising wholesale prices and more, it becomes tough to discern where the market might go next. With that said, many of the points made are valid concerns for the economic future.
Whether you want to try to buy the next dip or feel it is best to be wary of another major correction, the charts can help guide us through both situations. Knowing and managing your risk is one of the most important parts of successful trading. Therefore, looking back on the chart to predict future price action is key for analyzing the market’s next move.
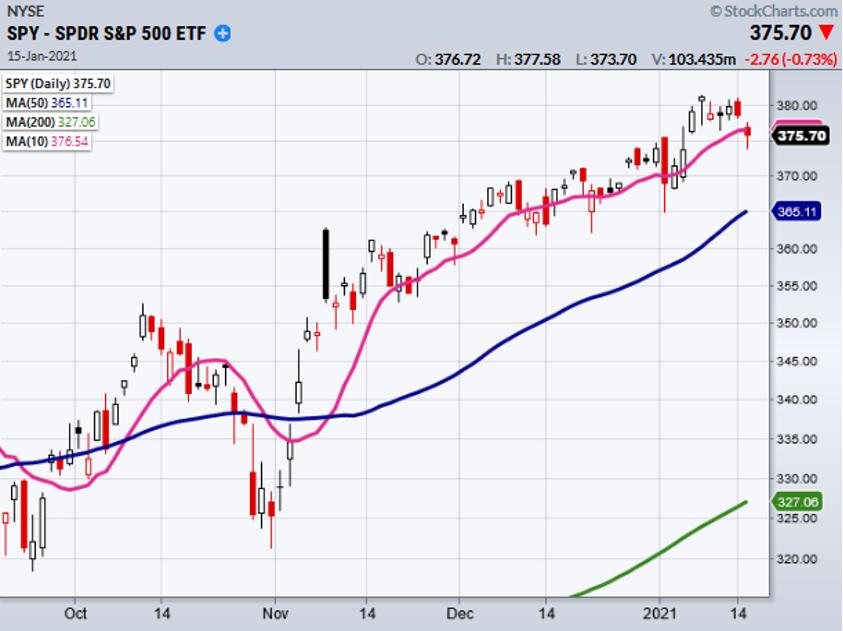
Looking at the S&P500 (SPY), if we can stay over the 375.40 area, we hold the support of January 4th high or the first trading day of the year. This is an ideal place to hold, as a large correction could bring the price down to the 50-day moving average (Blue line) sitting at 365.11.
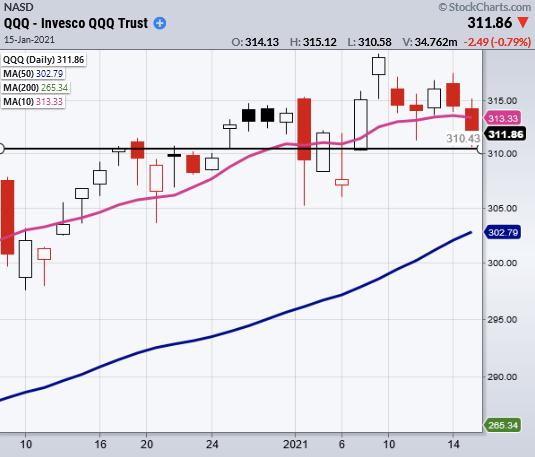
The Nasdaq 100 (QQQ) has minor support coming in around 310, with Friday’s low of 310.58 and the low of 1/7 at 310.25. The next strongest support is at 305, or the 50-DMA.
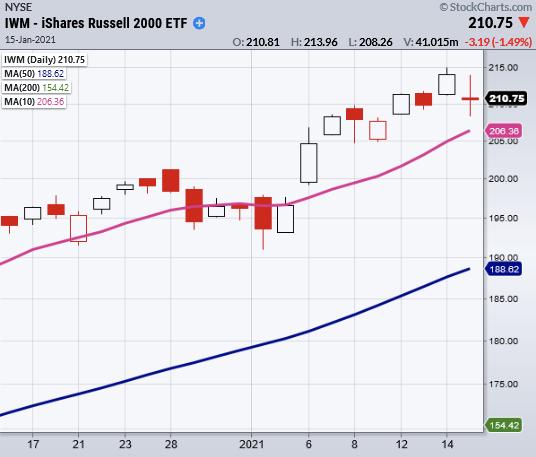
The Russell 2000 (IWM) sits with the largest space between the 50-DMA. The relative strength shows a slight overbought condition on the monthly timeframe even after Friday’s correction. Even so, IWM had the most support throughout the day compared to the SPY and QQQ.
While it would be normal and healthy for a pullback, IWM has continued to show tremendous strength. Friday’s doji candle (tight range day with the opening and closing prices practically the same) shows the battle between buyers and sellers is to be continued.
In this week’s edition of StockCharts TV‘s Mish’s Market Minute, Mish discusses the agricultural tech space now that food commodities have blasted off. Also, she covers the rush to space, a key theme for 2021, with an analysis of some actionable stocks to take advantage of as we explore the new space exploration frontier.
Whenever you’re ready, here are 3 ways I can help you reach your trading goals…
- Stay one step ahead of the market with my daily market analysis, Mish’s Daily.
- Get the foundational building blocks of my trading strategies from my book Plant Your Money Tree: A Guide to Building Your Wealth, and accompanying bonus training.
- Trade with me and take your trading the next level by following my real-time trading ideas as a member of my premium services.
- S&P 500 (SPY): Like this to hold 375.40
- Russell 2000 (IWM): Doji day. 204.60 support
- Dow (DIA): Needs to get back over the 10-DMA at 308.56
- Nasdaq (QQQ): 310 support. Resistance 319.39
- KRE (Regional Banks): Resistance 63.82. Support 55.90
- SMH (Semiconductors): 221.79 support.
- IYT (Transportation): 225.80 the 10-DMA held
- IBB (Biotechnology): 158.42 needs to hold
- XRT (Retail): 69.10 the 10-DMA closest support
Mish Schneider
MarketGauge.com
Director of Trading Research and Education
Forrest Crist-Ruiz
MarketGauge.com
Assistant Director of Trading Research and Education