This data is from the CDC.
According to the CDC, on Vaccinations.
Total doses administered: 311,886,674, as of yesterday 310,645,827. Daily: 1.24 million.
| COVID Metrics | |||
|---|---|---|---|
| Current | Yesterday | Goal | |
| Percent over 18, One Dose | 64.6% | 64.5% | ≥70.0%1,2 |
| Fully Vaccinated (millions) | 145.8 | 144.9 | ≥1601 |
| New Cases per Day3 | 12,415 | 12,676 | ≤5,0002 |
| Hospitalized3 | 14,232 | 13,944 | ≤3,0002 |
| Deaths per Day3 | 292 | 325 | ≤502 |
| 1 America’s Goal by July 4th, 2my goals to stop daily posts, 37 day average for Cases, Hospitalized, and Deaths |
|||
KUDOS to the residents of the 14 states and D.C. that have already achieved the 70% goal: Vermont, Hawaii and Massachusetts are at 80%+, and Connecticut, New Jersey, Maine, Rhode Island, Pennsylvania, New Mexico, California, New Hampshire, Maryland, Washington, New York and D.C. are all over 70%.
Next up are Illinois at 69.7%, Virginia at 69.3%, Minnesota at 68.7%, Delaware at 68.4%, Colorado at 68.0%, Oregon at 68.0% and Wisconsin at 64.2%.
 Click on graph for larger image.
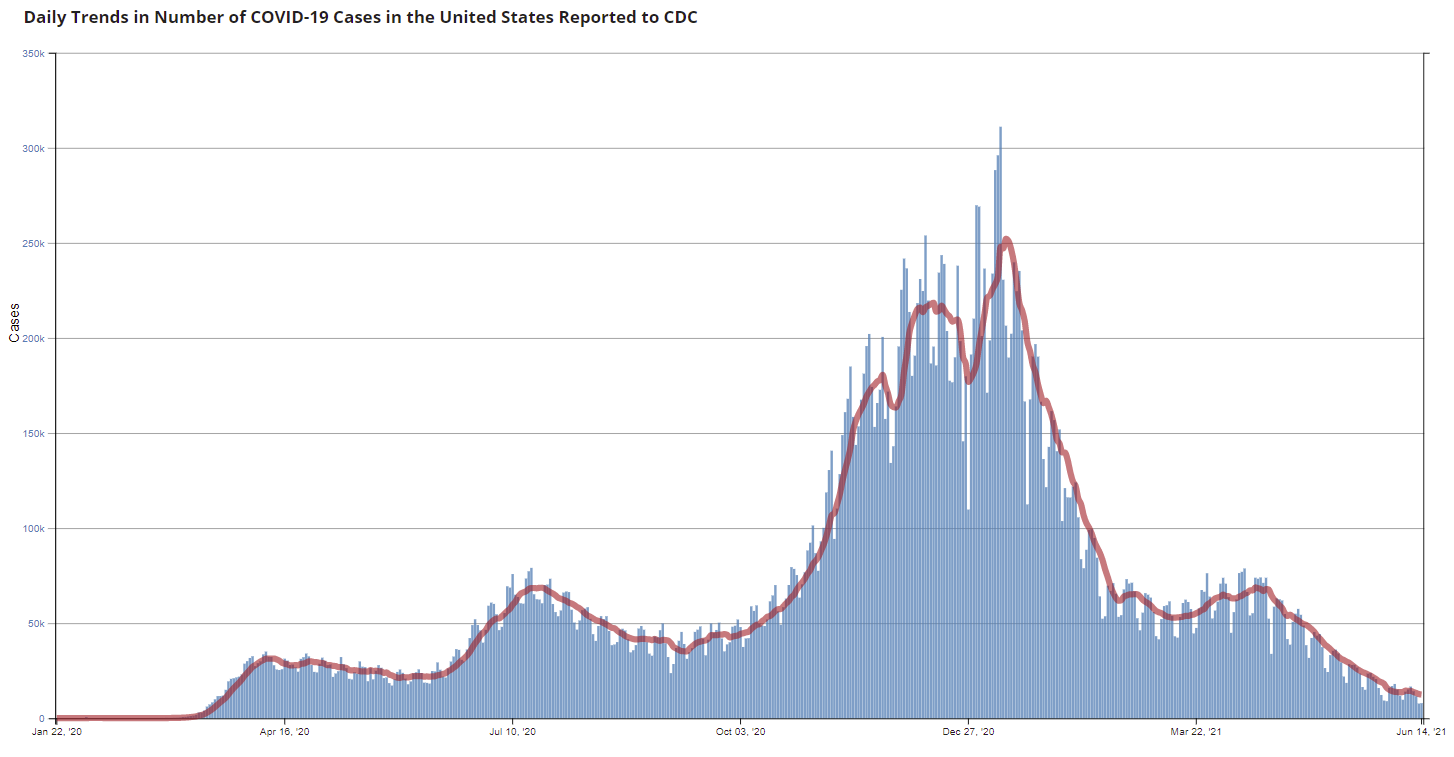
This graph shows the daily (columns) and 7 day average (line) of positive tests reported.
This data is from the CDC.