A few cautious flags were thrown up today in spite of the new all-time highs in NASDAQ.
- The volume was light. After Friday’s spike in volume, Monday QQQs saw below-average daily volume.
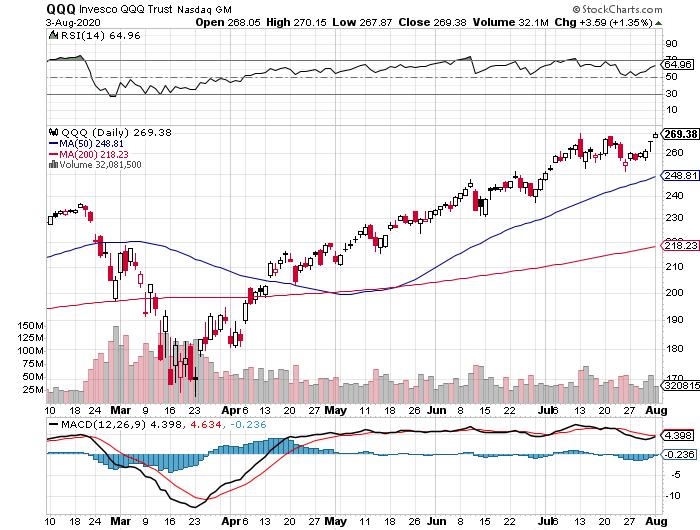
- The momentum indicators that we use to measure tops, bottoms, and big trends show a divergence between momentum and price. The momentum on NASDAQ’s last trip to new highs on July 13th had higher momentum than today’s, with a new all-time high. This type of divergence can often become a leading indicator that precedes a top.
- Couple the lower volume with the divergence in momentum and one can conclude that the bulls are growing less enthusiastic.
- The last swing high on July 13th was at 269.79, which became the 6-month calendar range high. That is yet another indicator we use that often becomes the top or bottom or launch pad for trading an instrument over the next 6 months. Monday’s high was 270.15, but QQQs closed at 269.21 or under the 6-month calendar range high.
- S&P 500 (SPY): 323 now pivotal support, 332.58 a gap to fill
- Russell 2000 (IWM): Held the 200-WMA and now has 150 resistance
- Dow (DIA): 270 resistance, 262.50 support
- Nasdaq (QQQ): 262 support and 270 resistance
- KRE (Regional Banks): Cannot get out of its own way
- SMH (Semiconductors): 165-168 pivotal – 170 resistance
- IYT (Transportation): 172.55 support, 179-180 resistance
- IBB (Biotechnology): 142 resistance, 136 support
- XRT (Retail): Looks like Granny wants 50.00
- Volatility Index (VXX): Watching carefully as holding the 200-DMA at 27.90
- Junk Bonds (JNK): Risk appetite waned, but held the key support at 105.30
- LQD (iShs iBoxx High-Yield Bonds): 137.50 support
Mish Schneider
MarketGauge.com
Director of Trading Research and Education