The S&P 500 index has remained in consolidation mode, spending the shortened holiday week in a rally back to the upper end of the recent trading range. Last week on The Final Bar, I announced “The Mindful Six”, a group of six stocks that I feel will be helpful in identifying the next direction for equities. One of the six has already turned negative, and I’ll show you the levels I’m watching for breakdown potential in the other five stocks.
Let’s start with a chart of the S&P 500 index, which I believe drives home the truly neutral read here. While some indicators are pointing higher, others are indicating potential weakness in the coming weeks.
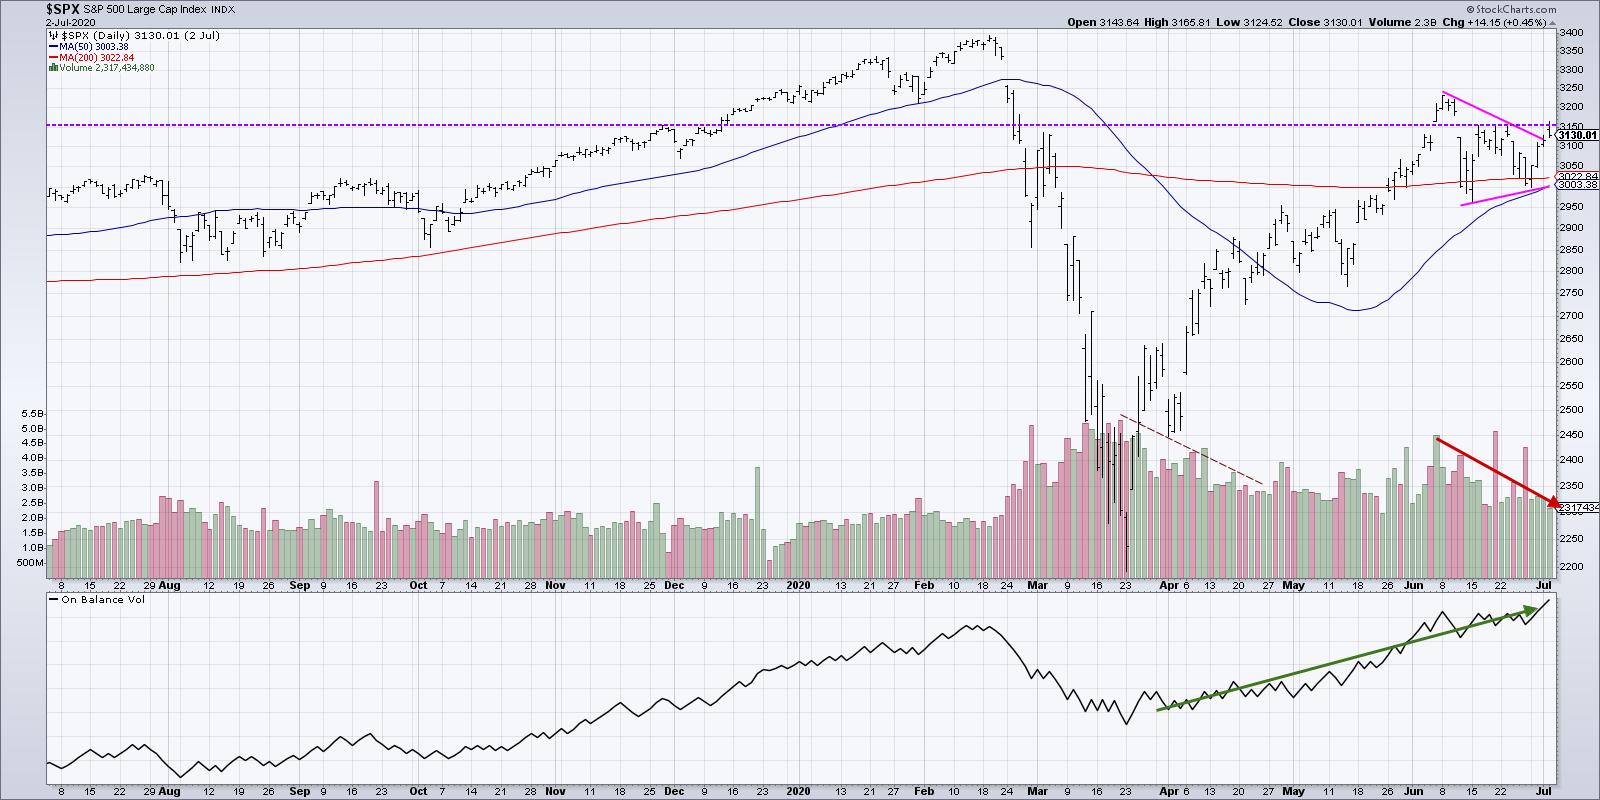
After topping out around 3240 in early June, the S&P 500 gapped lower, which completed an island reversal pattern. This key index then bounced off the 200-day moving average, followed by a test of resistance around 3150. The S&P actually had a daily high right at the 3150 level three out of six trading sessions.
Where did the S&P close out during the shortened holiday week? You guessed it, right around 3150.
Over the last four weeks, the chart has taken on a symmetrical triangle or “coil” pattern, which you could actually consider a pennant pattern. I’ve always found nomenclature like this to be of questionable value. I’m more concerned with the fact that the market has found an equilibrium where buyers and sellers are in balance. The range is narrowing, which usually means a break is coming soon.
During this pennant pattern, the volume has lessened pretty consistently, with the exception of two days that saw relatively high volume. These were actually due to the triple witching day and end-of-the-quarter rebalancing. Other than that, the volume steadily declined, which is fairly normal for this type of pattern.
The on-balance volume has been in an uptrend since the March low, which shows that, even though we’ve had some down days on heavy volume (what I would term “distribution days”), overall the volume on the up days has outweighed volume on down days. What you’re looking for here is a divergence, where the price would go higher but the OBV would trend lower. We have not seen that signal yet.
Now let’s get to The Mindful Six and how I’m using these six stock charts in my process.
A couple weeks ago, I wrote an article called “Three Stocks That Tell You Everything” which hit on three names I thought would be a good barometer for the overall market. I came up with these stocks during one of my weekend chart reviews, where I go through the entire S&P 500 index chart by chart, looking for themes and patterns in individual names and groups and sectors.
During last week’s chart review, I identified three more stocks that appeared to be in similar patterns and combined them all as The Mindful Six. Basically, I looked for stocks that had either a) broken above their 200-day moving average and pulled back soon after, or b) failed at their 200-day moving average and now were threatening to make a new swing low.
So, to summarize, here are six stocks that are in a consolidation phase similar to the broad S&P 500 index and other benchmarks. While I will be analyzing the S&P chart as always, I’ve often found that breakdowns will first emerge within individual names, as investors begin taking profits on higher beta plays. The S&P 500 will remain elevated as investors rotate to defensive positions in mega-cap stocks that will continue to buoy the overall market.
My original three stocks were Applied Materials (AMAT), Morgan Stanley (MS) and Starbucks (SBUX). I’ve now added Cisco (CSCO), Nike (NKE) and Disney (DIS). Here’s how I would label them after last week’s trading:
Bullish (has not made a lower high yet):
AMAT
Neutral (has made lower high but not lower low):
MS
SBUX
CSCO
NKE
Bearish (has made a lower high and lower low):
DIS
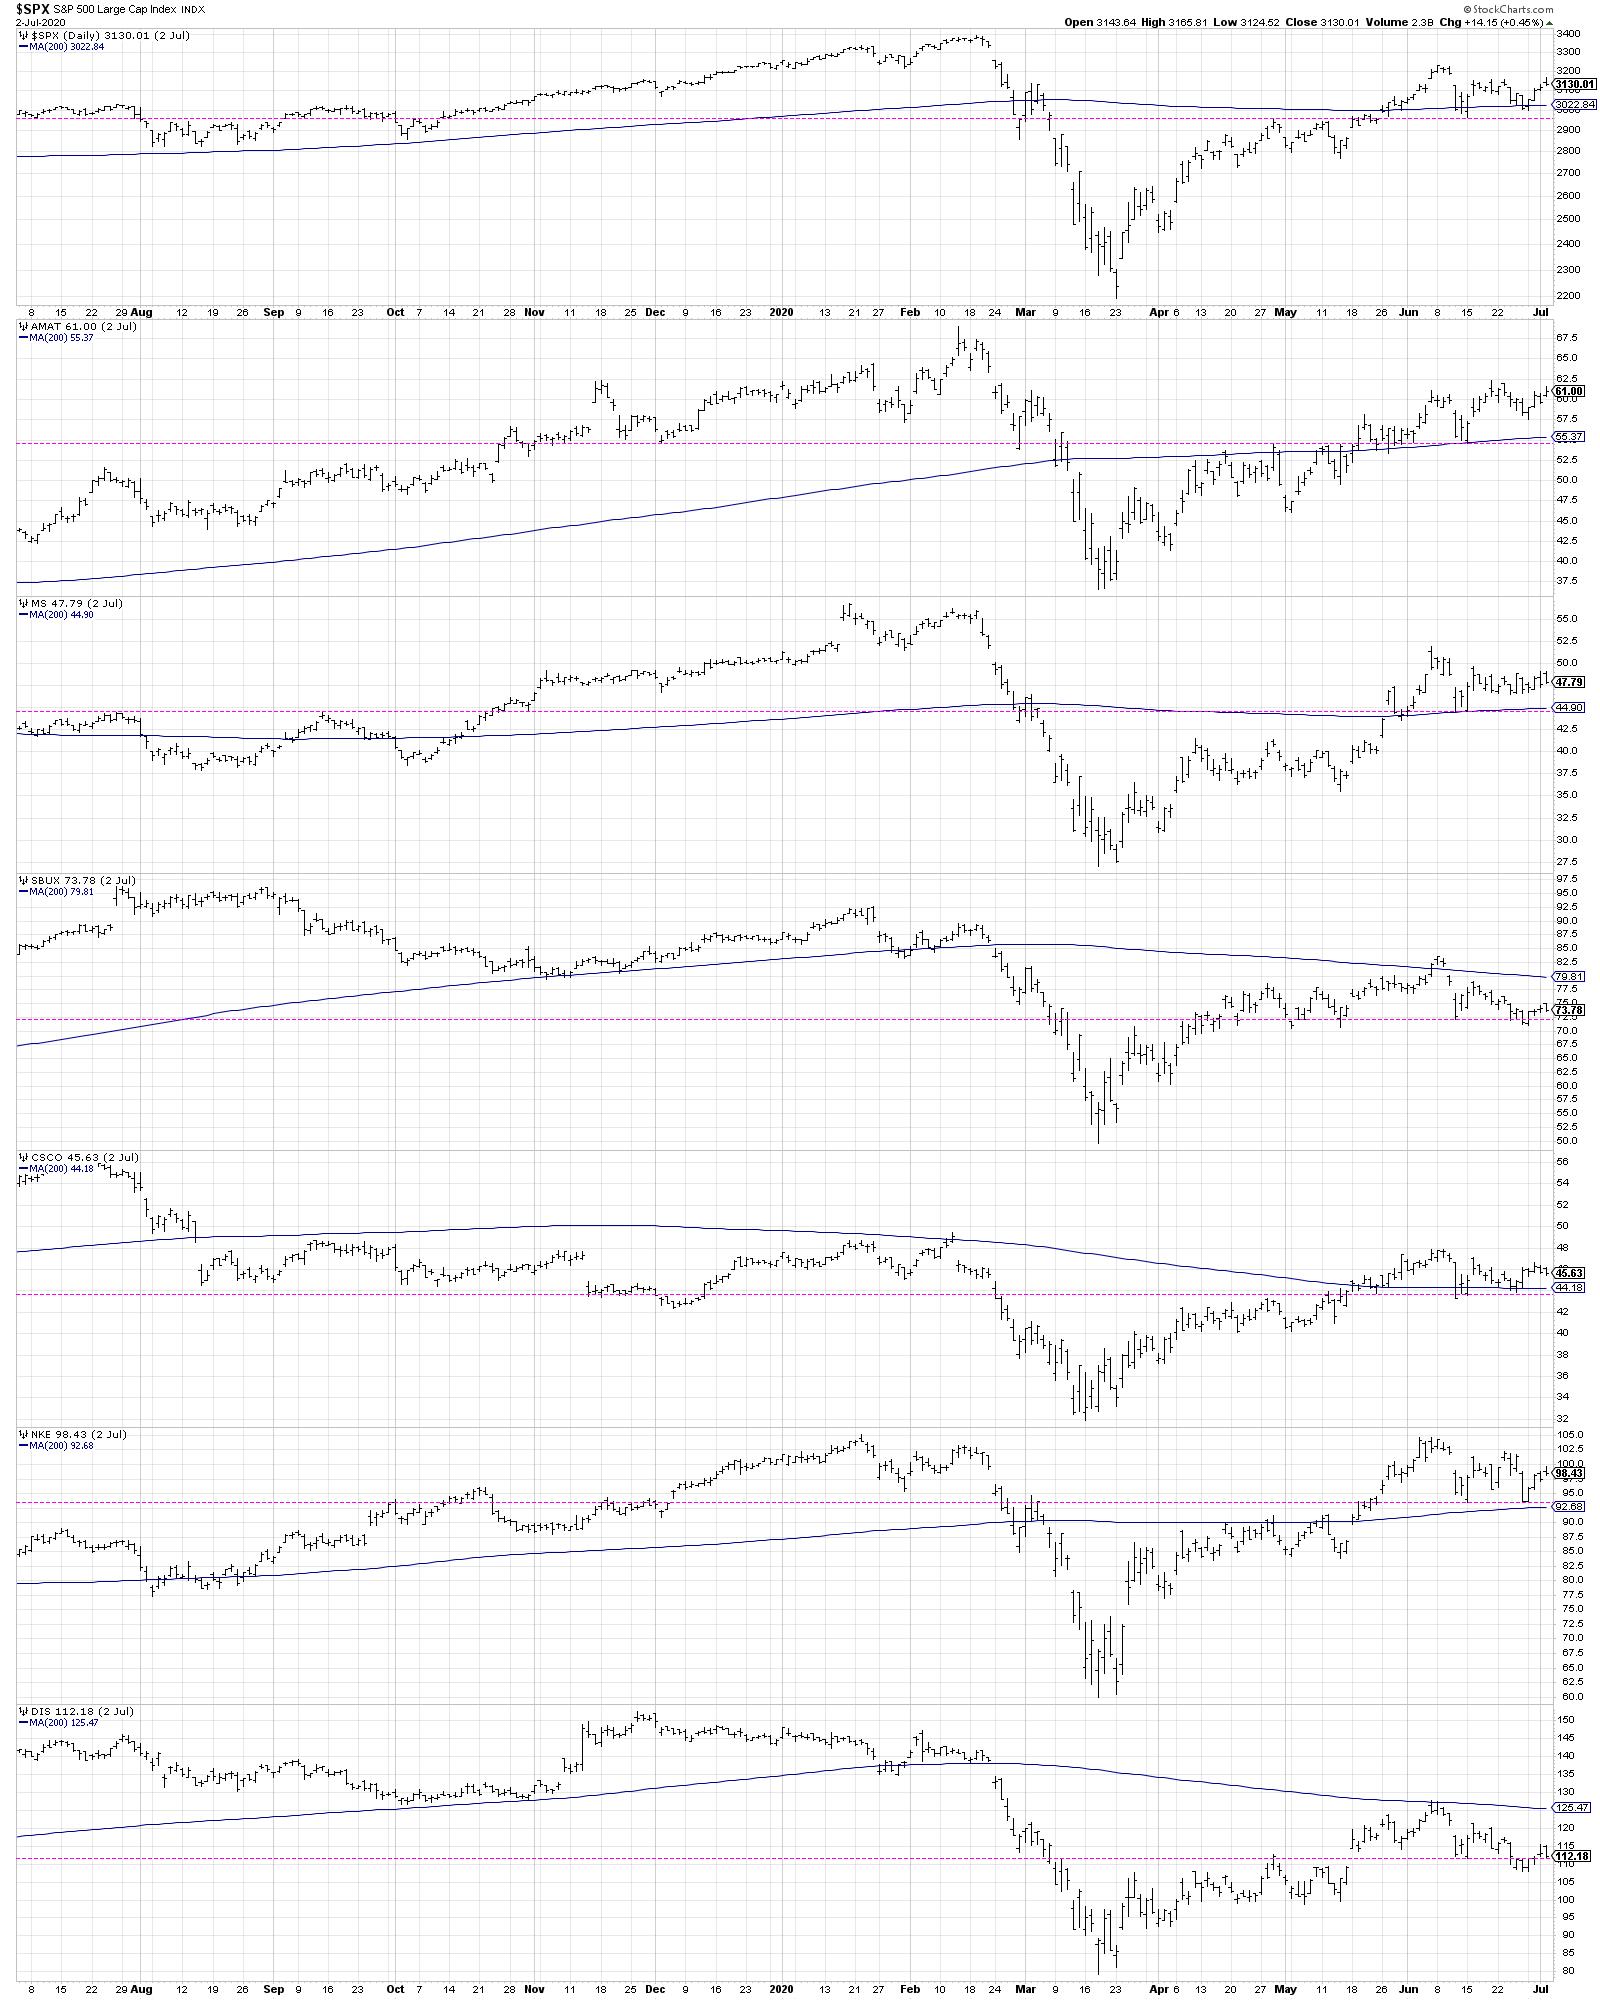
It’s interesting to note that Starbucks briefly broke to a new swing low at the end of last week, but, as it did not follow through the next day, I still consider it to be in a consolidation range.
So there you have six stocks, one in Financials, one from Communication Services, two in Technology and two from the Consumer Discretionary sector. All six have the potential to break to rally from current levels, establishing a new higher high as they progress to a retest of their 2020 highs. All six also have the potential to break down, failing at support as they indicate new short-term downtrends.
I would suspect that the weight of the evidence of these six names will be quite helpful in understanding how six names outside of the FANGMAN trade are faring and, in turn, where the market as a whole will be headed next.
RR#6,
Dave
David Keller, CMT
Chief Market Strategist
StockCharts.com
Disclaimer: This blog is for educational purposes only and should not be construed as financial advice. The ideas and strategies should never be used without first assessing your own personal and financial situation, or without consulting a financial professional.
The author does not have a position in mentioned securities at the time of publication. Any opinions expressed herein are solely those of the author, and do not in any way represent the views or opinions of any other person or entity.