U.S. hotel performance dipped from the previous week, while indexed comparisons against 2019 improved on the favorable side of a holiday calendar shift, according to STR‘s latest data through July 2.
June 26 to July 2, 2022 (percentage change from comparable week in 2019*):
• Occupancy: 67.3% (+2.9%)
• Average daily rate (ADR): $153.32 (+19.7%)
• Revenue per available room (RevPAR): $103.24 (+23.1%)Given historical trends, the week-over-week decline in demand was normal given the holiday. Since 2000, the Fourth of July or the observance of the holiday (federal holiday) has fallen on a Monday seven times, including last year and in 2016. In every case, occupancy in the week before the holiday fell by more than four percentage points with most of the losses beginning on Wednesday and continuing into the weekend. Occupancy and demand are likely to fall again for this current week before strengthening in the remaining weeks of July.
*Due to the pandemic impact, STR is measuring recovery against comparable time periods from 2019.
emphasis added
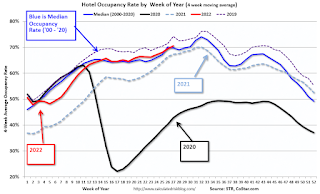
The following graph shows the seasonal pattern for the hotel occupancy rate using the four-week average.

The red line is for 2022, black is 2020, blue is the median, and dashed light blue is for 2021. Dashed purple is 2019 (STR is comparing to a strong year for hotels).