U.S. hotel performance data ending with 13 June showed another small rise from previous weeks and less severe year-over-year declines, according to STR.
7-13 June 2020 (percentage change from comparable week in 2019):
• Occupancy: 41.7% (-43.4%)
• Average daily rate (ADR): US$89.09 (-33.9%)
• Revenue per available room (RevPAR): US$37.15 (-62.6%)“Powered by the slow and steady rise in weekly demand, the industry clawed its way above 40% occupancy,” said Alison Hoyt, STR’s senior director, consulting & analytics. “That was still down substantially from the comparable week last year (73.6%) but an obvious improvement from the country’s low point in mid-April. As we have noted, the drive-to destinations with access to beaches, mountains and parks continue to lead the early leisure recovery. With more consistent demand, we’re beginning to see more pricing confidence in those areas as well.”
emphasis added
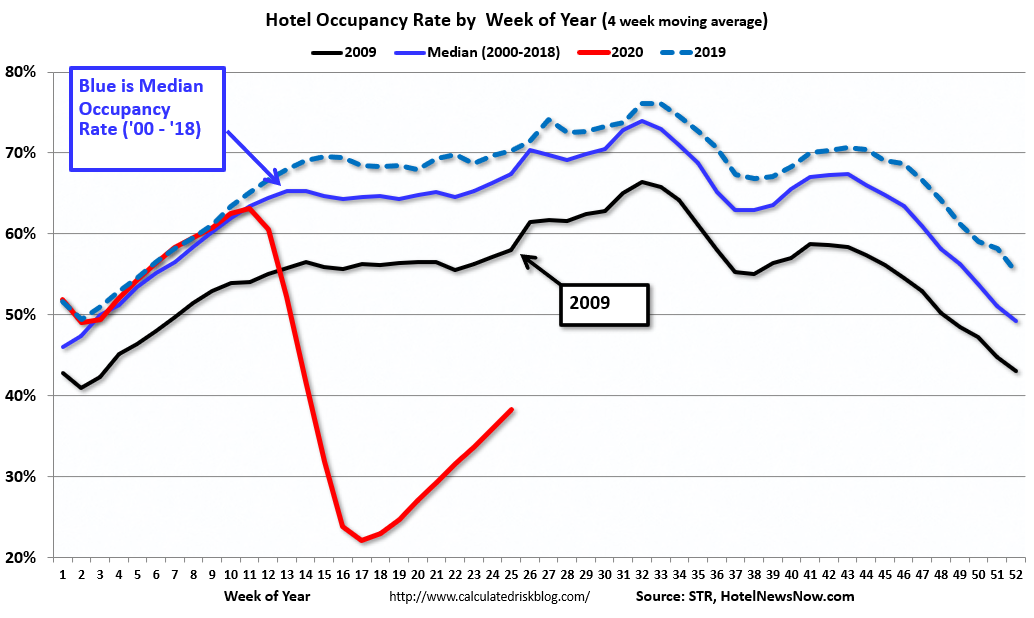
The following graph shows the seasonal pattern for the hotel occupancy rate using the four week average.
 Click on graph for larger image.
The red line is for 2020, dash light blue is 2019, blue is the median, and black is for 2009 (the worst year probably since the Great Depression for hotels).
Usually hotel occupancy starts to pick up seasonally in early June. So even though the occupancy rate was up slightly compared to last week, the year-over-year decline was about the same this week as the previous two weeks (43.4% decline vs. 45.3% last week, and 43.2% decline two weeks ago).
Note: Y-axis doesn’t start at zero to better show the seasonal change.