The Healthcare SPDR (XLV) formed two bullish continuation patterns within its long-term uptrend and recent breakouts bode well for further gains.
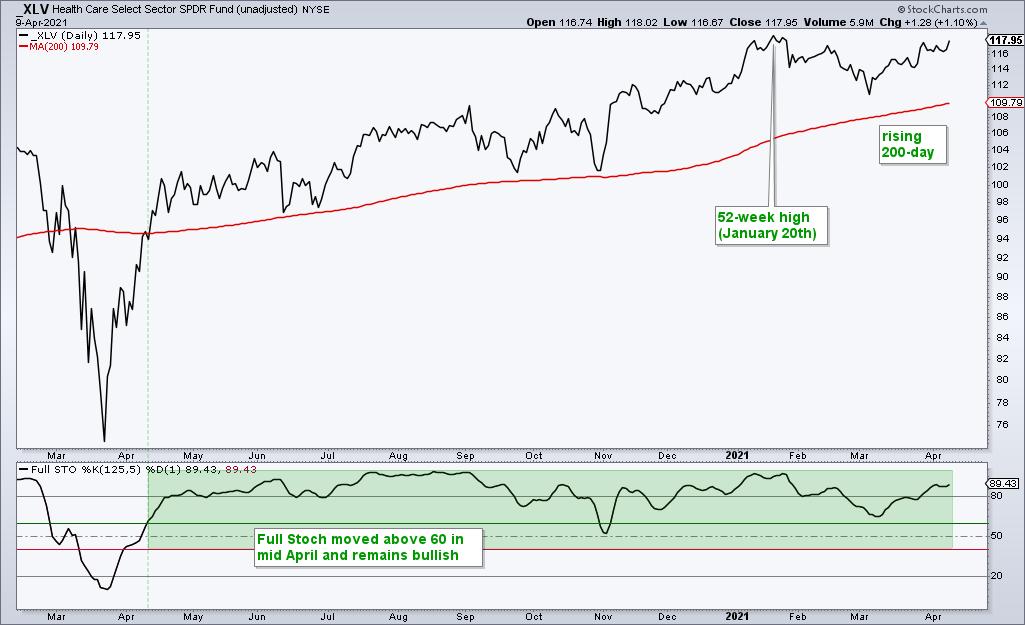
First and foremost, the long-term trend is up for XLV. The ETF is above its rising 200-day SMA and within 1% of its January high, which was a 52-week high. The Full Stochastic (125,5,1) moved above 60 to turn bullish in mid April 2020 and remains bullish until a move below 40.

The 125-day Full Stochastic measures the location of the close relative to the 125-day price range. The indicator has not been below 50 since April 2020 and this means price has been in the upper half of its six month range (125 days) since April 2020. In other words, the trend cup is half full.
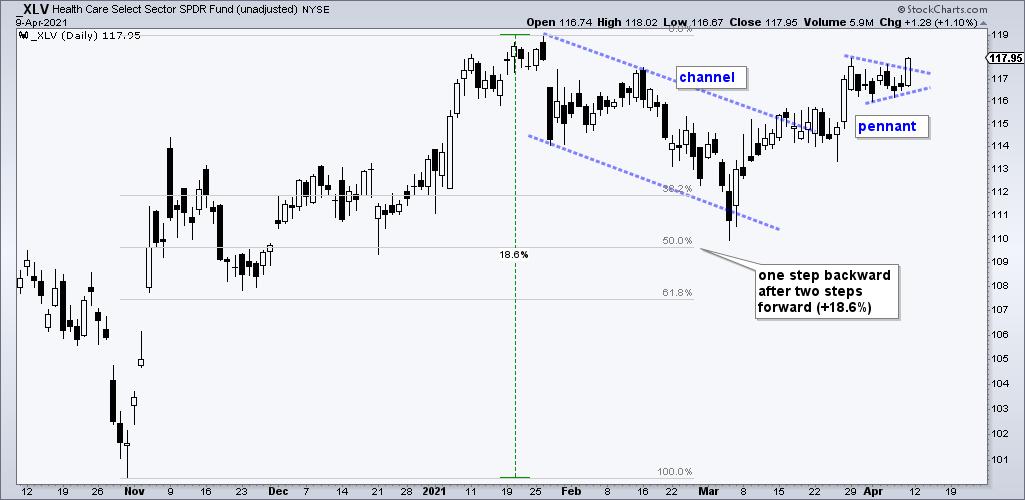
There are two bullish continuation patterns and two breakouts within the past month. First, the falling channel represents a correction and this pullback retraced half of the prior advance. Consider the 18.6% advance as two steps forward and the channel as one step backward. The mid March breakout ended the correction and signaled a continuation of the bigger uptrend.

XLV surged in late March and then consolidated in early April with a pennant. These are short-term bullish continuation patterns that represent a rest after a strong advance. XLV rested for seven days and then broke out with a long white candlestick on Friday.
Based on the two bullish breakouts and current uptrend, I would expect XLV to hit new highs in the coming days and weeks.
TrendInvestorPro specializes in capturing bullish setups and signals within bigger uptrends. Each week we monitor over 100 ETFs in our core list for trend signals, bullish price patterns, mean-reversion setups and short-term triggers. Click here to get a jump on the next breakout.
—————————————————————-