As I’ve suggested over the last two weeks, the stock market was poised for a breakout. And the odds for more gains in the short-term are still well above average. As a result, I am still not bearish, but, as time passes, it seems plausible that the market may change its general tone over the next few weeks.
Of course, much depends on what the Fed does, especially if it alters the way it buys bonds and delivers its QE. And there is emerging talk that changes are coming. Certainly, the biggest positive influence for stocks would be that the Fed increases the amount of money it puts into bonds, which is still an unknown. Moreover, even if the Fed doesn’t change the amount of QE but directs its purchases toward key areas in the yield curve, the likely decline in interest rates which could result from these maneuvers could have a positive effect on key market rates, especially mortgages, which is why the homebuilder stocks are showing signs of life and the lumber stocks continue their bullish advance as I describe below.
Meanwhile, after a torrid March, volume in the options market had fallen off some, resulting in a slower trading pace for stocks early in the week – until Friday, when the volume in the SPY options picked up, especially on the call buying side. This, in turn, tilted the expiration toward the bullish side, as the dealers were forced to hedge their bets and, in the process, bought stock and stock index futures.
Subsequently, unless something very dramatic happens, the Fed’s ongoing QE is more likely than not to keep the uptrend in stocks intact. That said, it seems that we may be nearing a point where some areas of the market will see more selling while others may see positive money flows. Thus, the bottom line remains that success will still be about selectivity.
Option Bulls Returned to Market at Week’s End
The three weekly expirations (M,W,F) for the SPDR S&P 500 ETF (SPY) last week were mixed, with Monday and Wednesday delivering lackluster volume and generally sloppy directional conviction. But, by Friday, the call buyers were more or less back in business and the directionally bullish expiration went off well for those of us long the market.
What this means is that, for now, the market remains in the hands of the bulls and that the odds of higher prices remain well above average. Next week may be interesting as Friday’s monthly expiration would mark three weeks of very bullish action in the markets, and could be an opportunity for the market makers to take some money off the table.
Incidentally, check out my upcoming options presentation “How to Let Your StockCharts Lead You to Great Covered Calls,” on StockCharts TV’s Options 101 program this week. You can catch me on Wednesday April 14th at 12:30 Eastern Time. More details here.
ASGN – Breakout Shows that a House in Order is Better than Being a Household Name
Flash isn’t always what makes a stock worth owning. And, in the case of the shares of midsize IT and government contractor ASGN Inc. (ASGN), this is the take-home message for sure, as the stock delivered a nice chart breakout on 4/9/21. Certainly, ASGN is not a household name, but it does have its house in order as its business recovers amidst expectations of increasing revenues due to government contracts. The company offers cybersecurity, website design and artificial intelligence, along with management and related services to health care.

According to the company’s most recent earnings call, EBITDA and free cash flow for its most recent fiscal year were above analyst expectations, but not above management’s expectations. In fact, the company’s moves during the COVID pandemic’s most troublesome period were more than adequate to continue and to deliver year-over-year growth in two of its business segments. Moreover, other areas of the business, especially due to acquisitions, were able to show sequential growth and were nearing breakeven point.
Moreover, the company now expects to grow its business due to the White House’s push toward IT modernization in the government, especially in defense and social services. And, with a $2 billion contract backlog in place and the addition of recent government contracts in place, the revenue stream should remain in good shape for some time.
The options data for ASGN is directionally bullish, which is a nice confirmation of its technicals where Accumulation Distribution (ADI) and On Balance Volume (OBV) suggest the stock is under aggressive accumulation. A decisive move above $102 could take the stock 5-10% higher in the next few weeks, barring an all-out market meltdown.
I just recommended an interesting option trade based on MSNT. You can access it and the rest of my model portfolio with a FREE trial here.
I have positions in ASGN and MNST as of this writing.
NYAD Makes New High along with SPX, NDX
The New York Stock Exchange Advance Decline line (NYAD) caught up to the S&P 500 (SPX) and made a series of new highs last week, confirming that we are still in an uptrend for stocks. More encouraging is the fact that RSI has not moved above 70 for NYAD yet, suggesting that stocks can still climb further. Moreover, even if the 70 area is breached, the market can stay in that overbought state for some time. In fact, what we’ve seen recently is that readings above 70 are more likely to lead to consolidations, not necessarily full-blown corrections. Of course, there is no guarantee that this will repeat, but it is worth noting.

Thus, as long as NYAD continues to make new highs, remains above its 50- and 200-day moving averages and has its corresponding RSI reading remain above 50, the trend remains up. This combined set of observations has been extremely reliable since 2016.

The Nasdaq 100 index (NDX) also caught up to SPX and, along with NYAD, has made new highs confirming the uptrend in stocks.

The S&P 500 (SPX) is now firmly leading the market after making a series of new highs. Support for SPX is now above 4000, with another band of support near 3930 and 3970.
Good news! I’ve made my NYAD-Complexity, Chaos chart (featured on my YD5 videos) and a few other favorites public. You can find them here.
Big Move Ahead Likely in Bonds
Stocks are still benefitting from what seems to be an intermediate-term consolidation in what is now a fairly clear pause in what has been the quietest bear market in U.S. Treasury bonds, probably in history. In addition, the trading range now for the U.S. Ten Year note (TNX) remains between 1.4 and 18%. That said, TNX continues to test the key 20-day moving average area, which could lead to a test of its 50-day moving average if the support at the 20 fails to hold. A fall below the 50-day moving average support level would put yields in an intermediate-term downtrend.

However, the U.S. 30-Year T-Bond yield (TYX) has fallen less than TNX, which suggests traders are still concerned about inflation but, given the potential for some difficulties in getting the infrastructure package through Congress, (at least without some changes that could decrease its inflationary potential), TYX may consolidate in a narrower range.
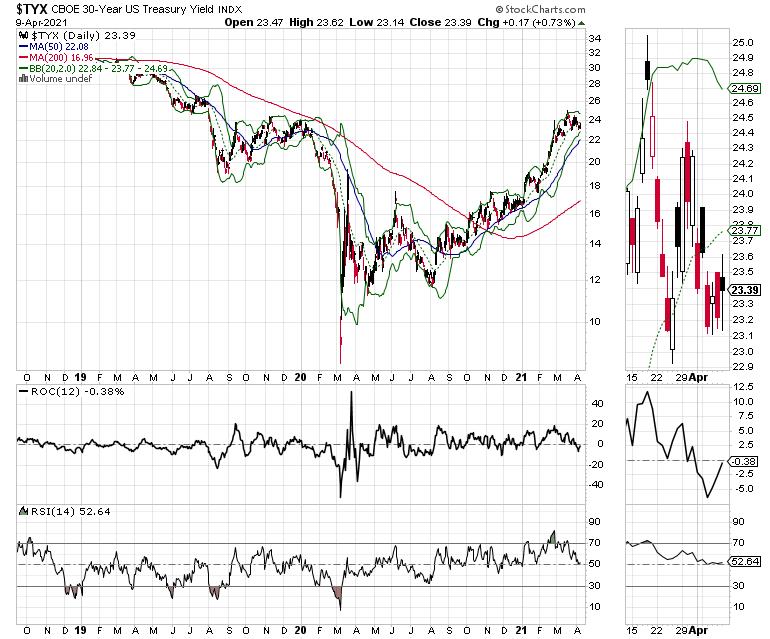
Still, the key remains what happens if and when TNX reaches 2% and TYX reaches 3%, how the Fed responds and then – of course – how stocks respond. For its own part, TYX is trading below its 20-day moving average, with the Bollinger Bands shrinking and the bond ETF options delivering a neutral message.
Finally, the price of lumber (LUMBER) continues to skyrocket, which is pulling along the lumber stocks, such as Louisiana Pacific (LPX), and homebuilders, such as KB Homes (KBH). Indeed, supply, demand and pricing power remain on the side of those two sectors of the economy, another example of how the markets, the economy and people’s lives are intertwined in the MEL system.
To learn more about bonds, lumber, and homebuilders and more, check out my recent Money Show presentation: The Trade of the Year. Check it out here, and consider a Free Trial to my service (click here).
I own shares of LPX and KBH as of this writing.
Joe Duarte
In The Money Options
Joe Duarte is a former money manager, an active trader and a widely recognized independent stock market analyst since 1987. He is author of eight investment books, including the best selling Trading Options for Dummies, rated a TOP Options Book for 2018 by Benzinga.com and now in its third edition, plus The Everything Investing in Your 20s and 30s Book and six other trading books.
The Everything Investing in Your 20s and 30s Book is available at Amazon and Barnes and Noble. It has also been recommended as a Washington Post Color of Money Book of the Month.
To receive Joe’s exclusive stock, option and ETF recommendations, in your mailbox every week visit https://joeduarteinthemoneyoptions.com/secure/order_email.asp.