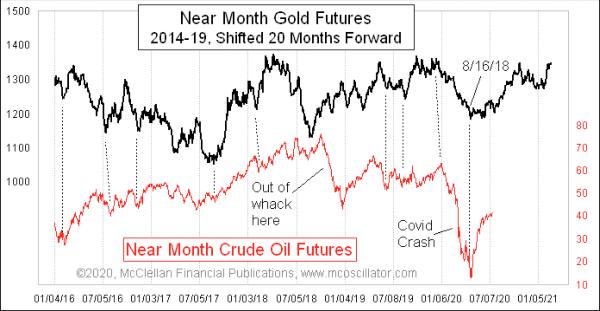
5 months ago, I wrote here about crude oil prices dropping below the $50 level and how that drop was unfolding in a way that was foretold by gold. In that article, I noted that gold’s 20-month leading indication said that more decline was still coming for crude oil prices. I noted that the August 2018 bottom in gold prices was foretelling a crude oil price bottom due in April 2020.
And that is what happened, with near-month crude oil prices bottoming on April 21, which was the day after the expiring May futures contract actually traded at negative prices. I had no way of knowing that the decline in oil prices which gold had foretold would be as severe as it was. Gold apparently did not know 20 months beforehand that there would be a worldwide pandemic and a compounding tussle between Saudi Arabia and Russia over OPEC (and friends) production cuts.
Even though the magnitude of the oil price crash was not completely foretold by gold’s prior action, gold did get the timing right. And gold also got it right about the rebound after that bottom, although the magnitude of that rebound was similarly extra robust just to make up for the more robust down move into the low.
Looking ahead, gold says that there is more upside movement yet to come for oil prices, heading toward an oil price top due in October, then a slide down into year-end. This week’s chart does not show the full picture of gold’s price action all the way up to the present day, and that is on purpose. If I included the most recent gold price data, it would distract the eye from seeing the message about what lies immediately ahead for oil prices. But understand that the scaling for gold prices on this chart only goes up to $1500, and right now gold is trading up near $1800. So over the next 20 months (at least), we can expect a big general uptrend in oil prices, assuming that gold’s message continues to work as well as it has been working for the last several years.