The reason why most people fail at investing and trading is that they do the opposite of what they should.
For example, they’ll buy at the highs and sell at the lows.
And that’s because it’s hard to control your emotions in trading.
FOMO, anger, greed, and fear can all wreak havoc on an individual’s trading.
Once you discover how to control your emotions, you’ll soon find out that some of the “riskiest” strategies you’ve been told your whole life to stay away from … offer some of the best chances to make consistent and profitable trades.
For example, have you ever been told not to “catch a falling knife” and avoid stocks that are in free fall?
I know I have.
But guess what?
It’s one of my bread-and-butter strategies. In fact, I’ve found several ways to identify when a stock is bottoming and is set up for a bounce, even when it looks like the stock is in free fall.
While I normally reserve this kind of education for my millionaire challenge students, I’m going to give you a sneak peek.
And show you how to profit from buying a stock that’s in free fall.
Where Did We Start?
I want to start with a stock that I never trade to demonstrate the power of these lessons.
Below is a chart of Peloton (NASDAQ: PTON), which I assume needs no introduction.
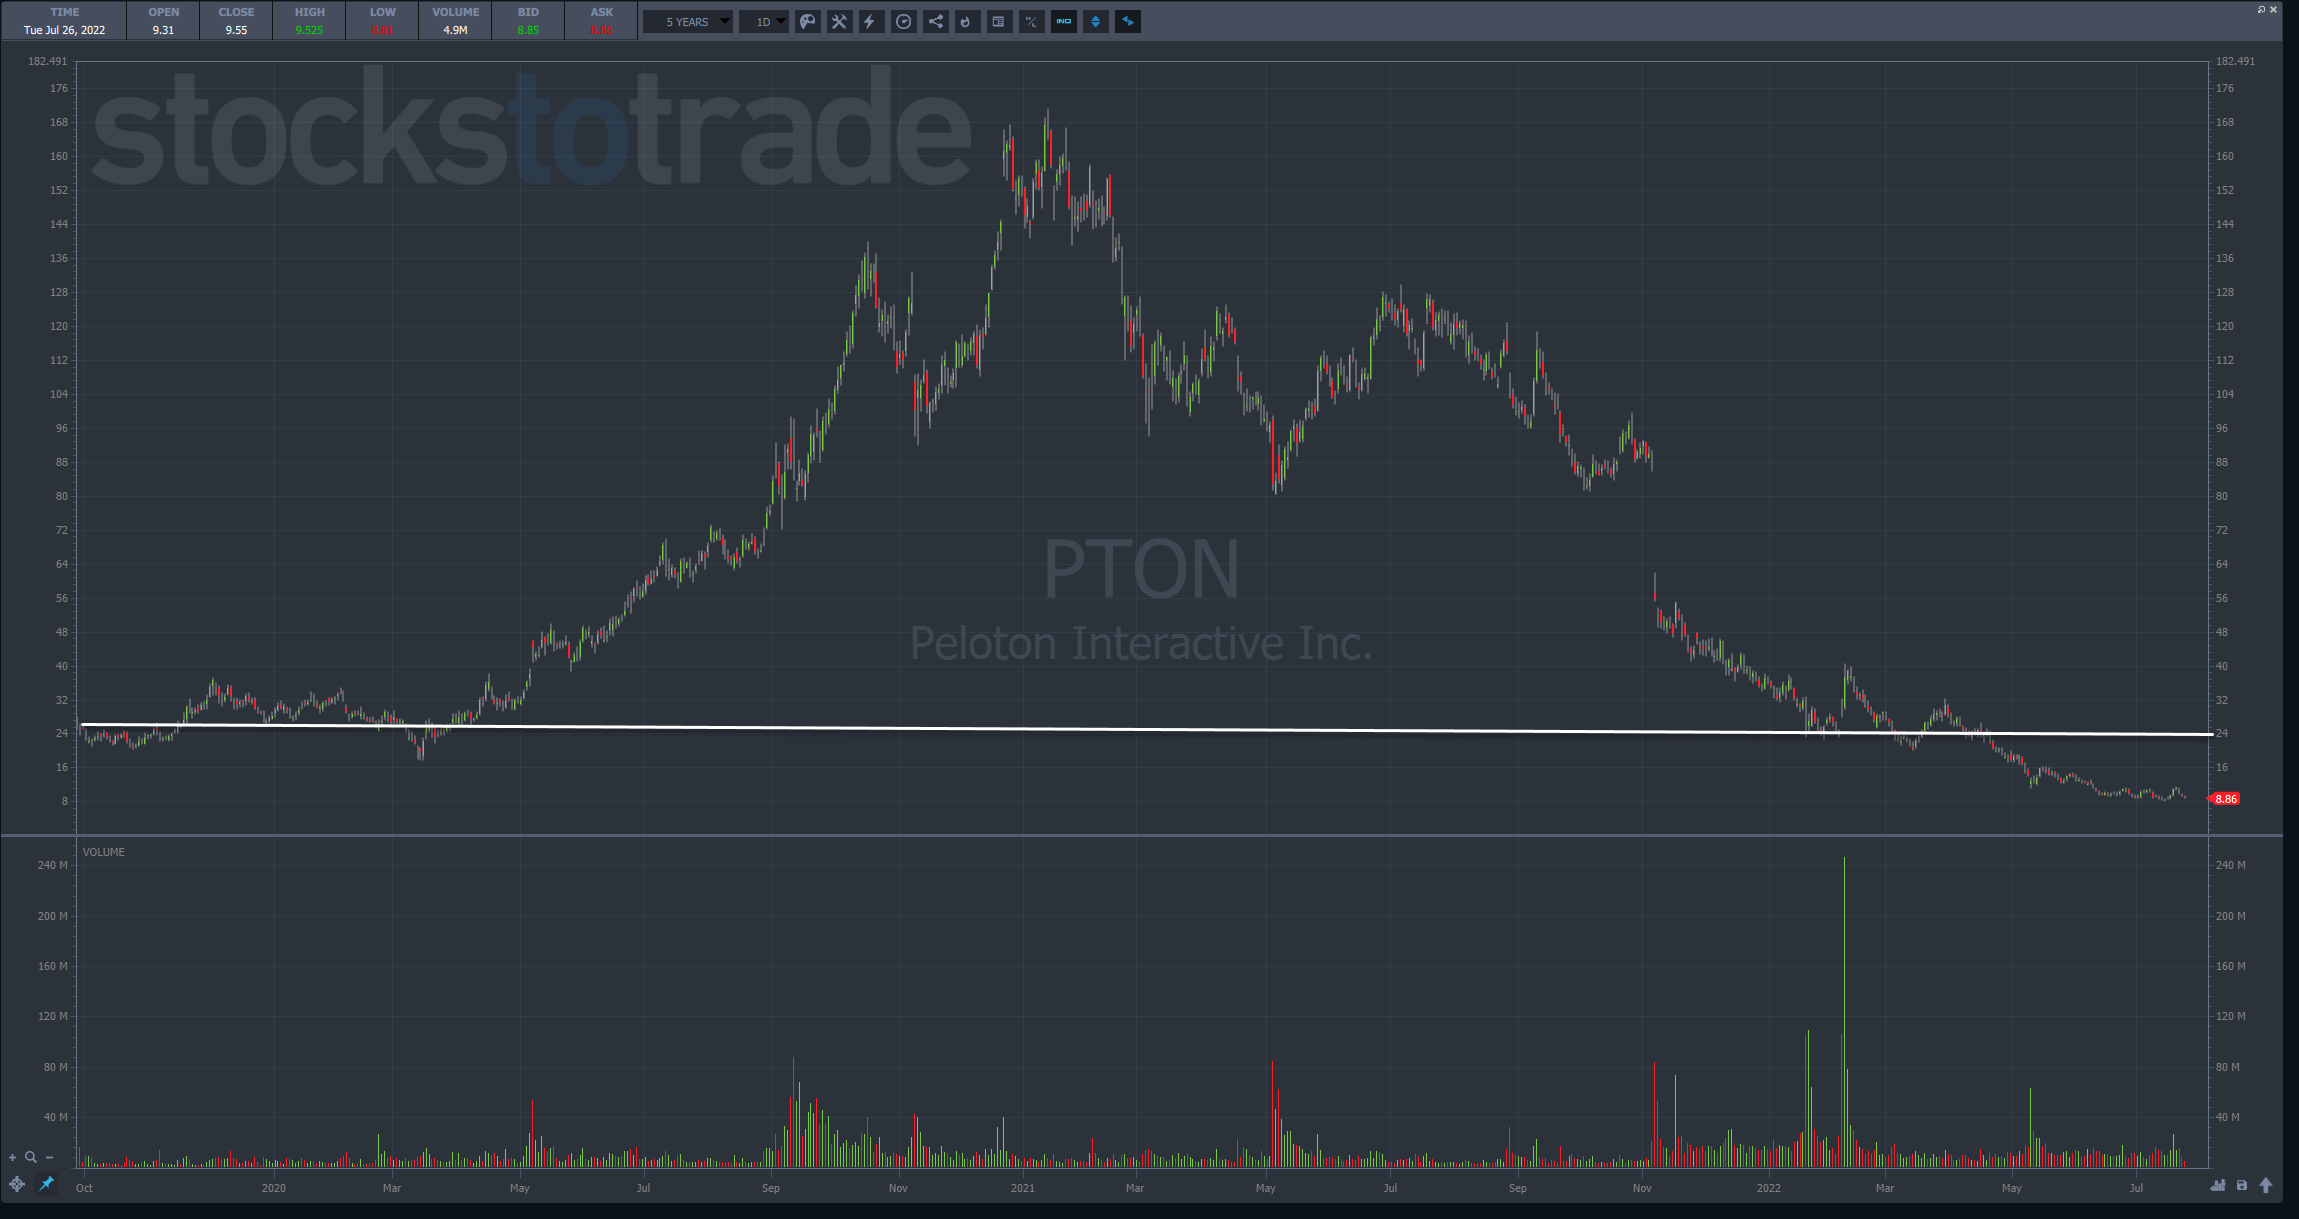
This is a stock that went parabolic and then crashed back down to earth.
I drew a white line where the stock opened during its first day of trading.
Years later, it found support at that same level when shares came crashing down.
If you can identify the breakout points for parabolic moves, they often act as levels of last resort for support.
Here’s an example with Emergent Health Corp. (OTC: EMGE).
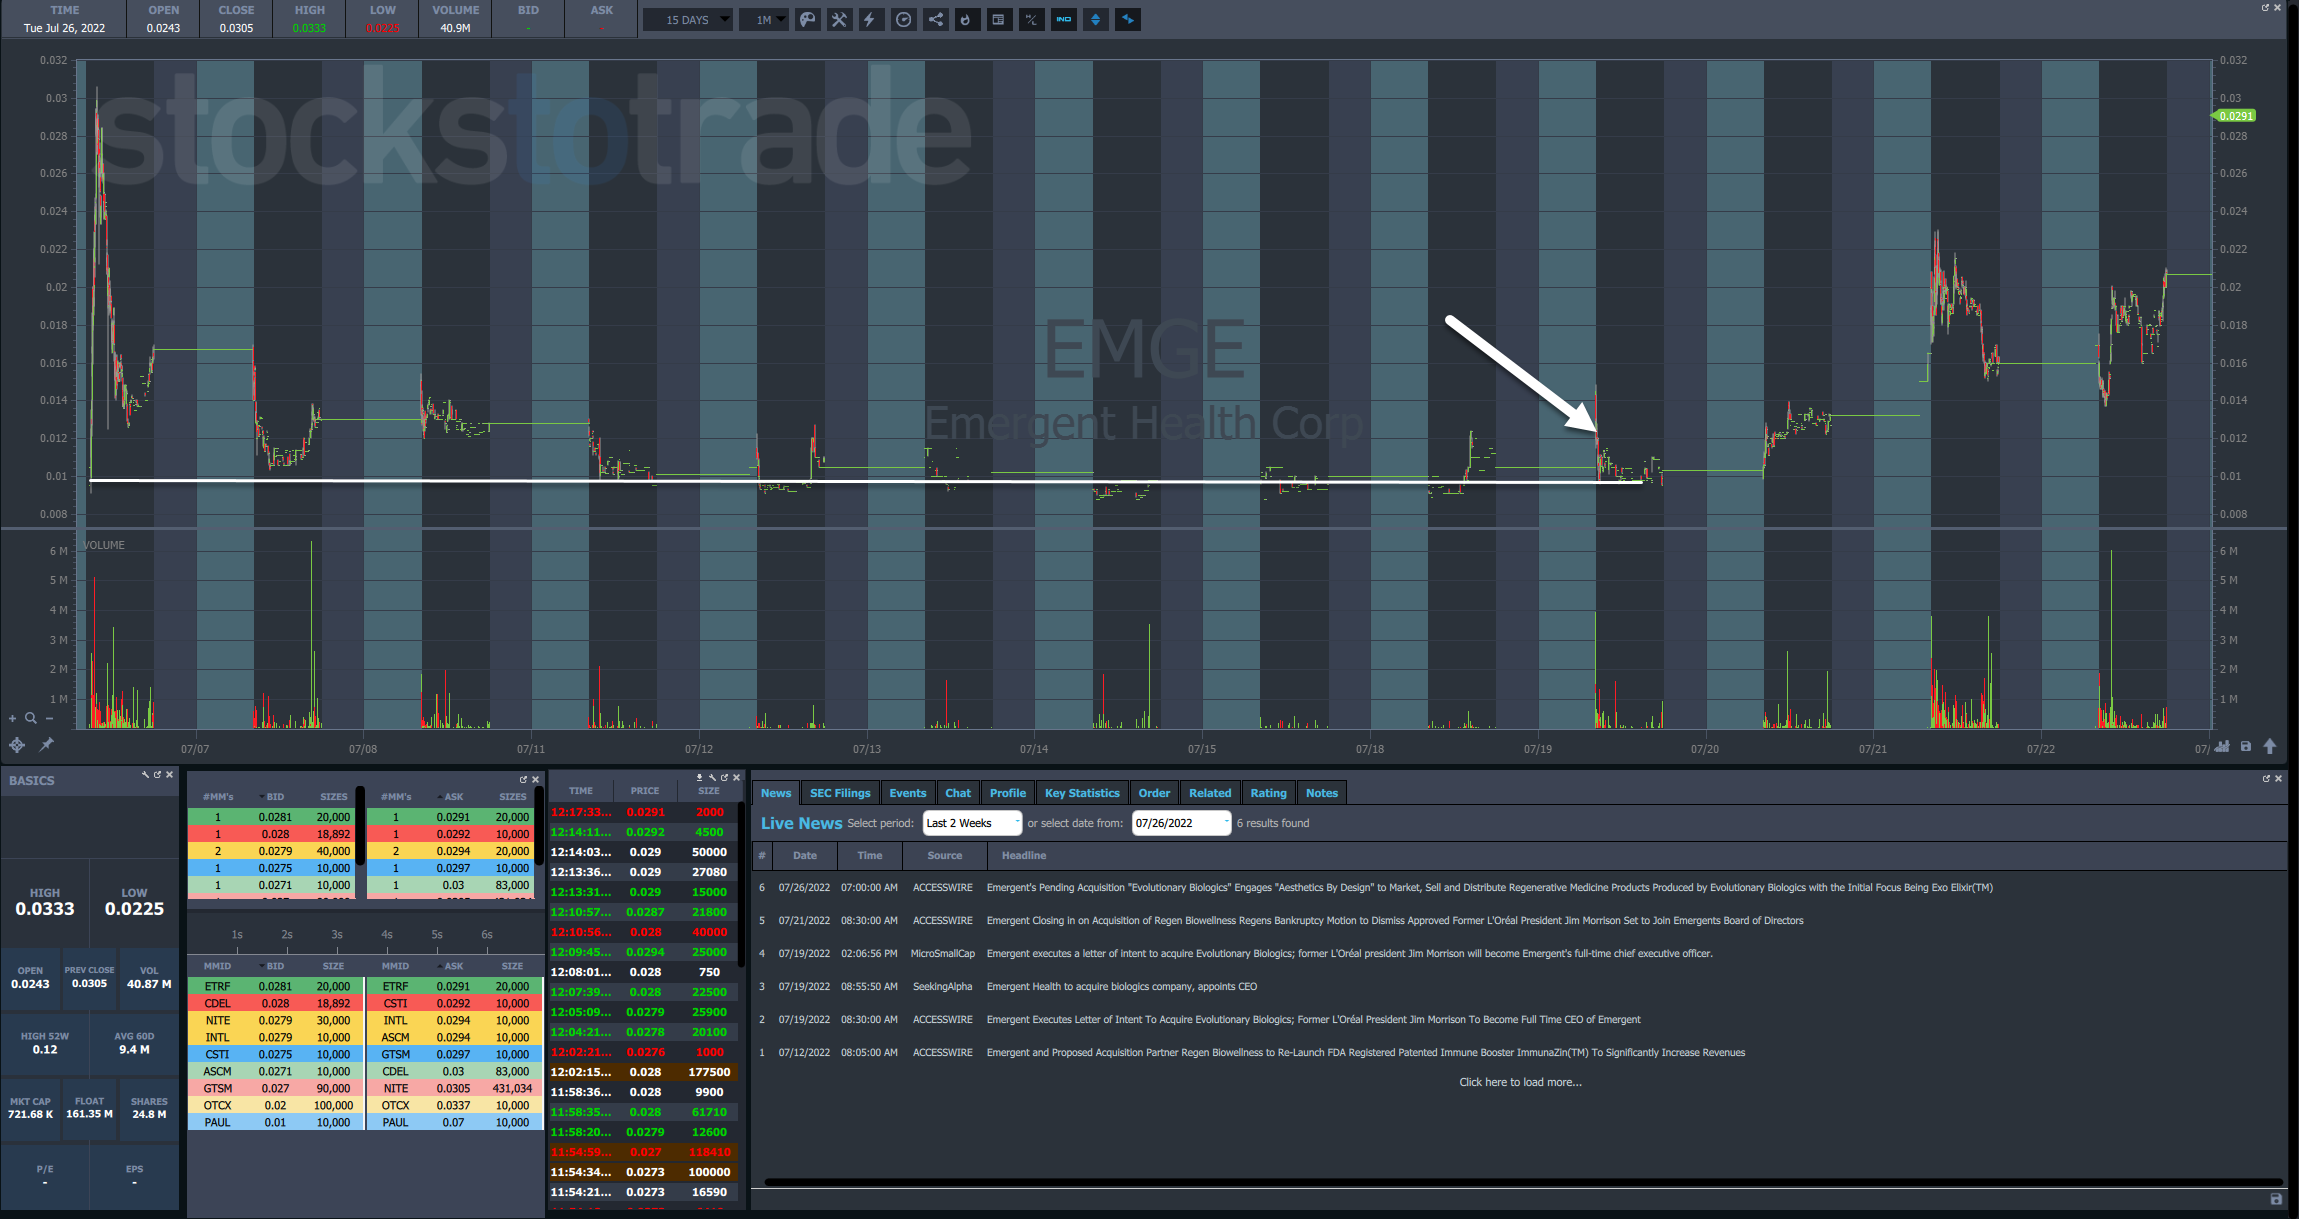
In this chart, I drew a white line at the open of the first day when the stock went parabolic.
Over the next week or so, shares held that level, albeit on light volume.
However, I want to zoom in on the 19th.
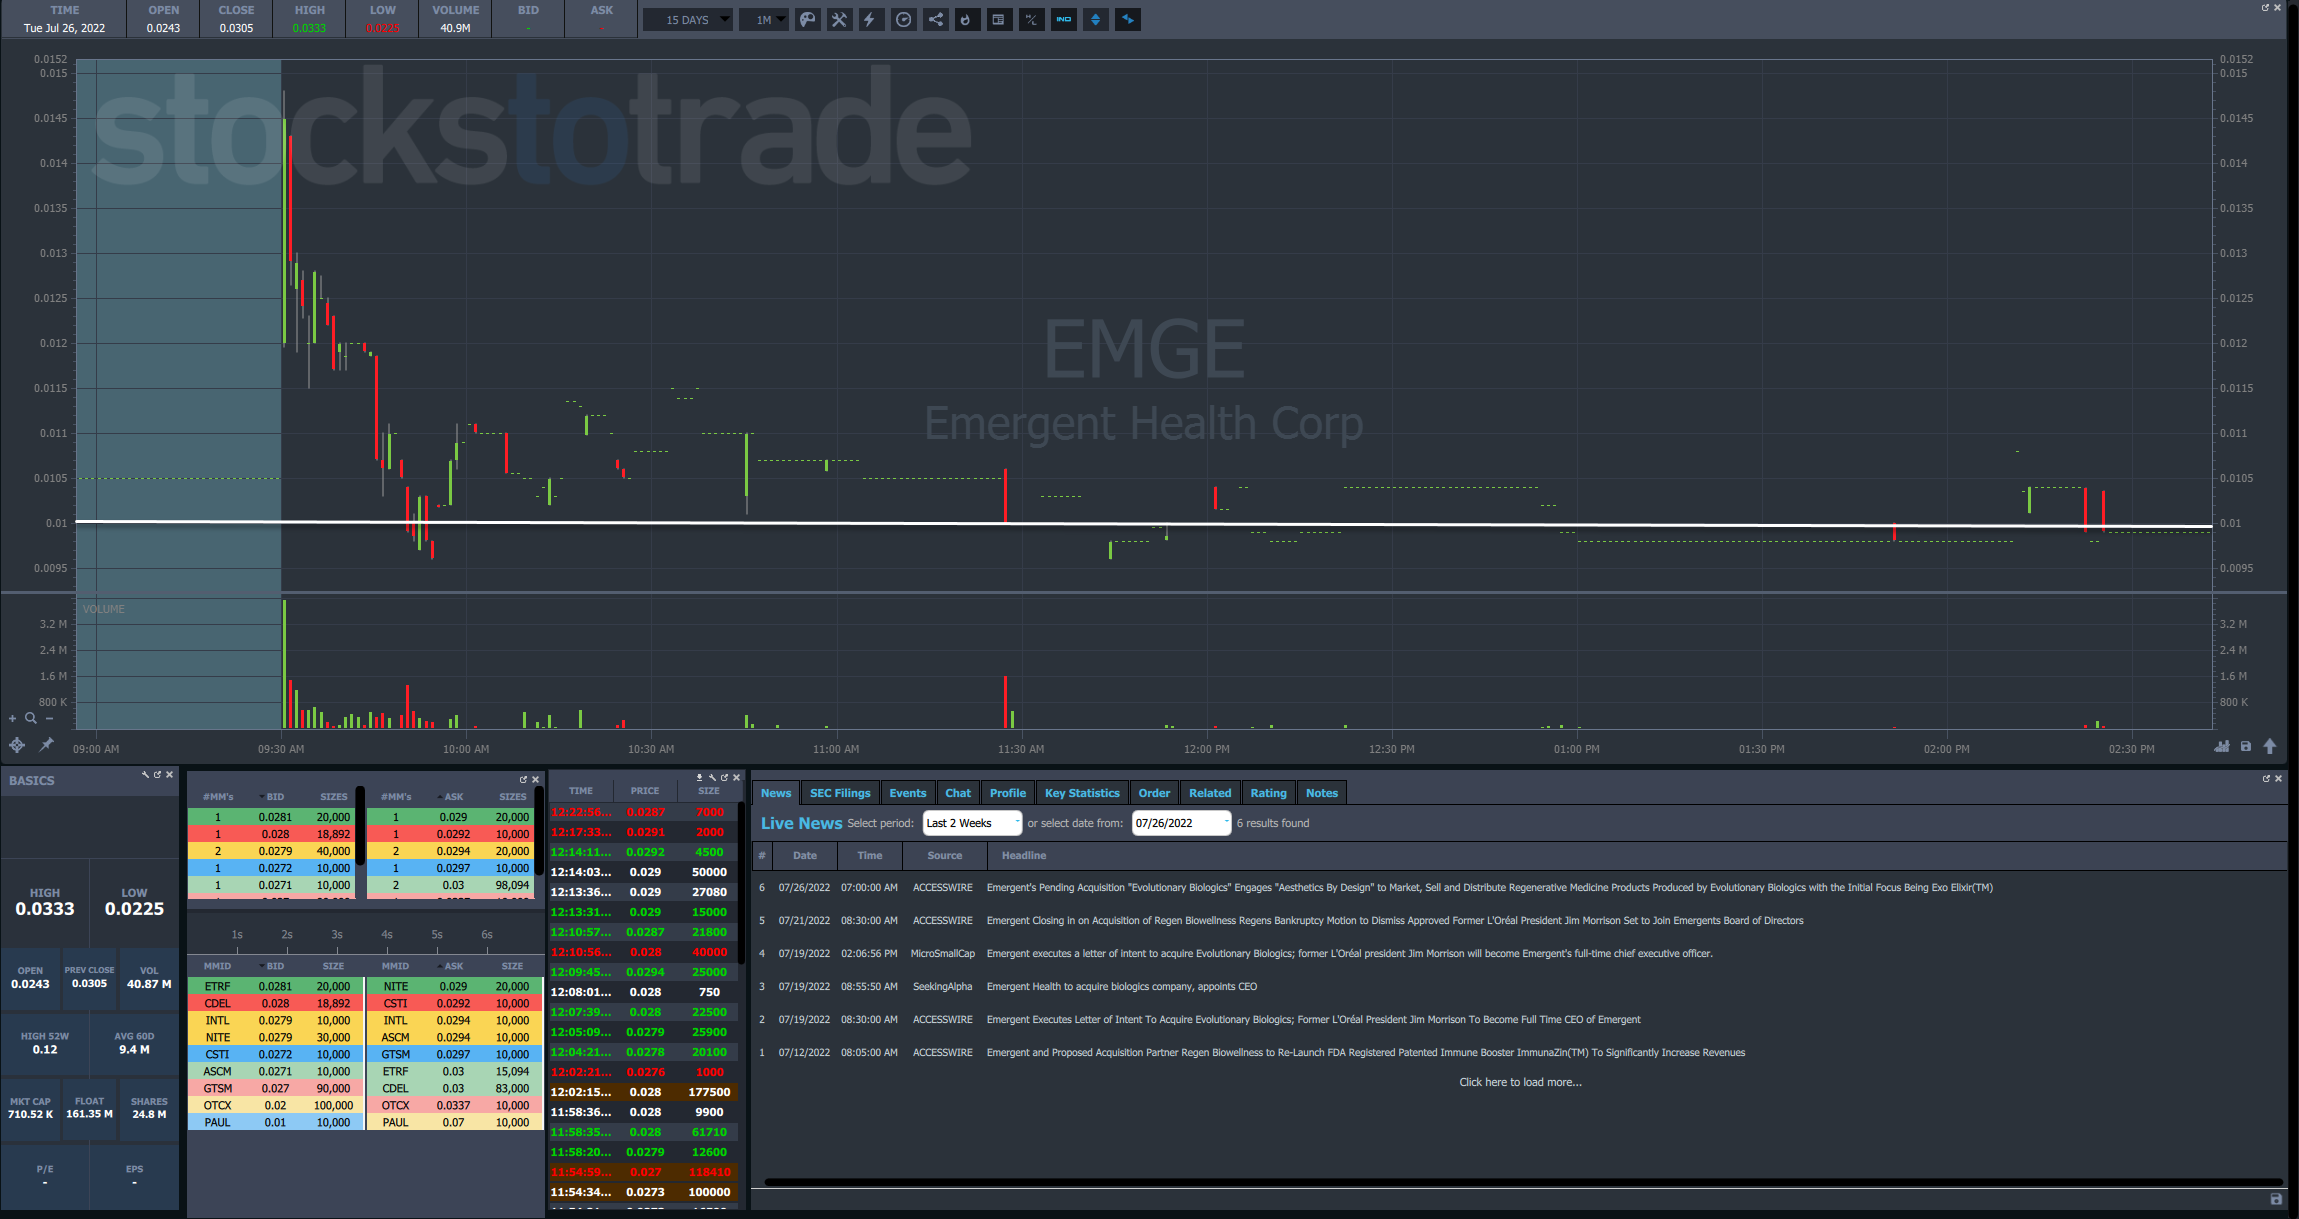
That same price level, which comes in at around $0.01, acted as key support when the stock opened higher, ran up, and came crashing back down.
You can identify support levels several different ways:
- Breakout zones
- Prior day’s close
- Consolidation areas
- Fibonacci retracements
There are dozens of different ways to locate these spots.
Here’s what you need to realize.
Support levels are areas where a stock is likely to stop.
We need to see buyers step in for it to hit that brick wall.
Watch Price Action
I found there are two ways to really fine-tune support levels.
First is to look at the volume and price response.
Say I identified a key support level. If a stock falls like a stone, a pickup in buying volume should hold the stock right there at support.
Let’s use SIGA Technologies Inc. (NASDAQ: SIGA) as an example.

In the chart above, I extended two white lines from different consolidation areas that could act as support.
Now, let’s dig into the day when shares were in freefall.
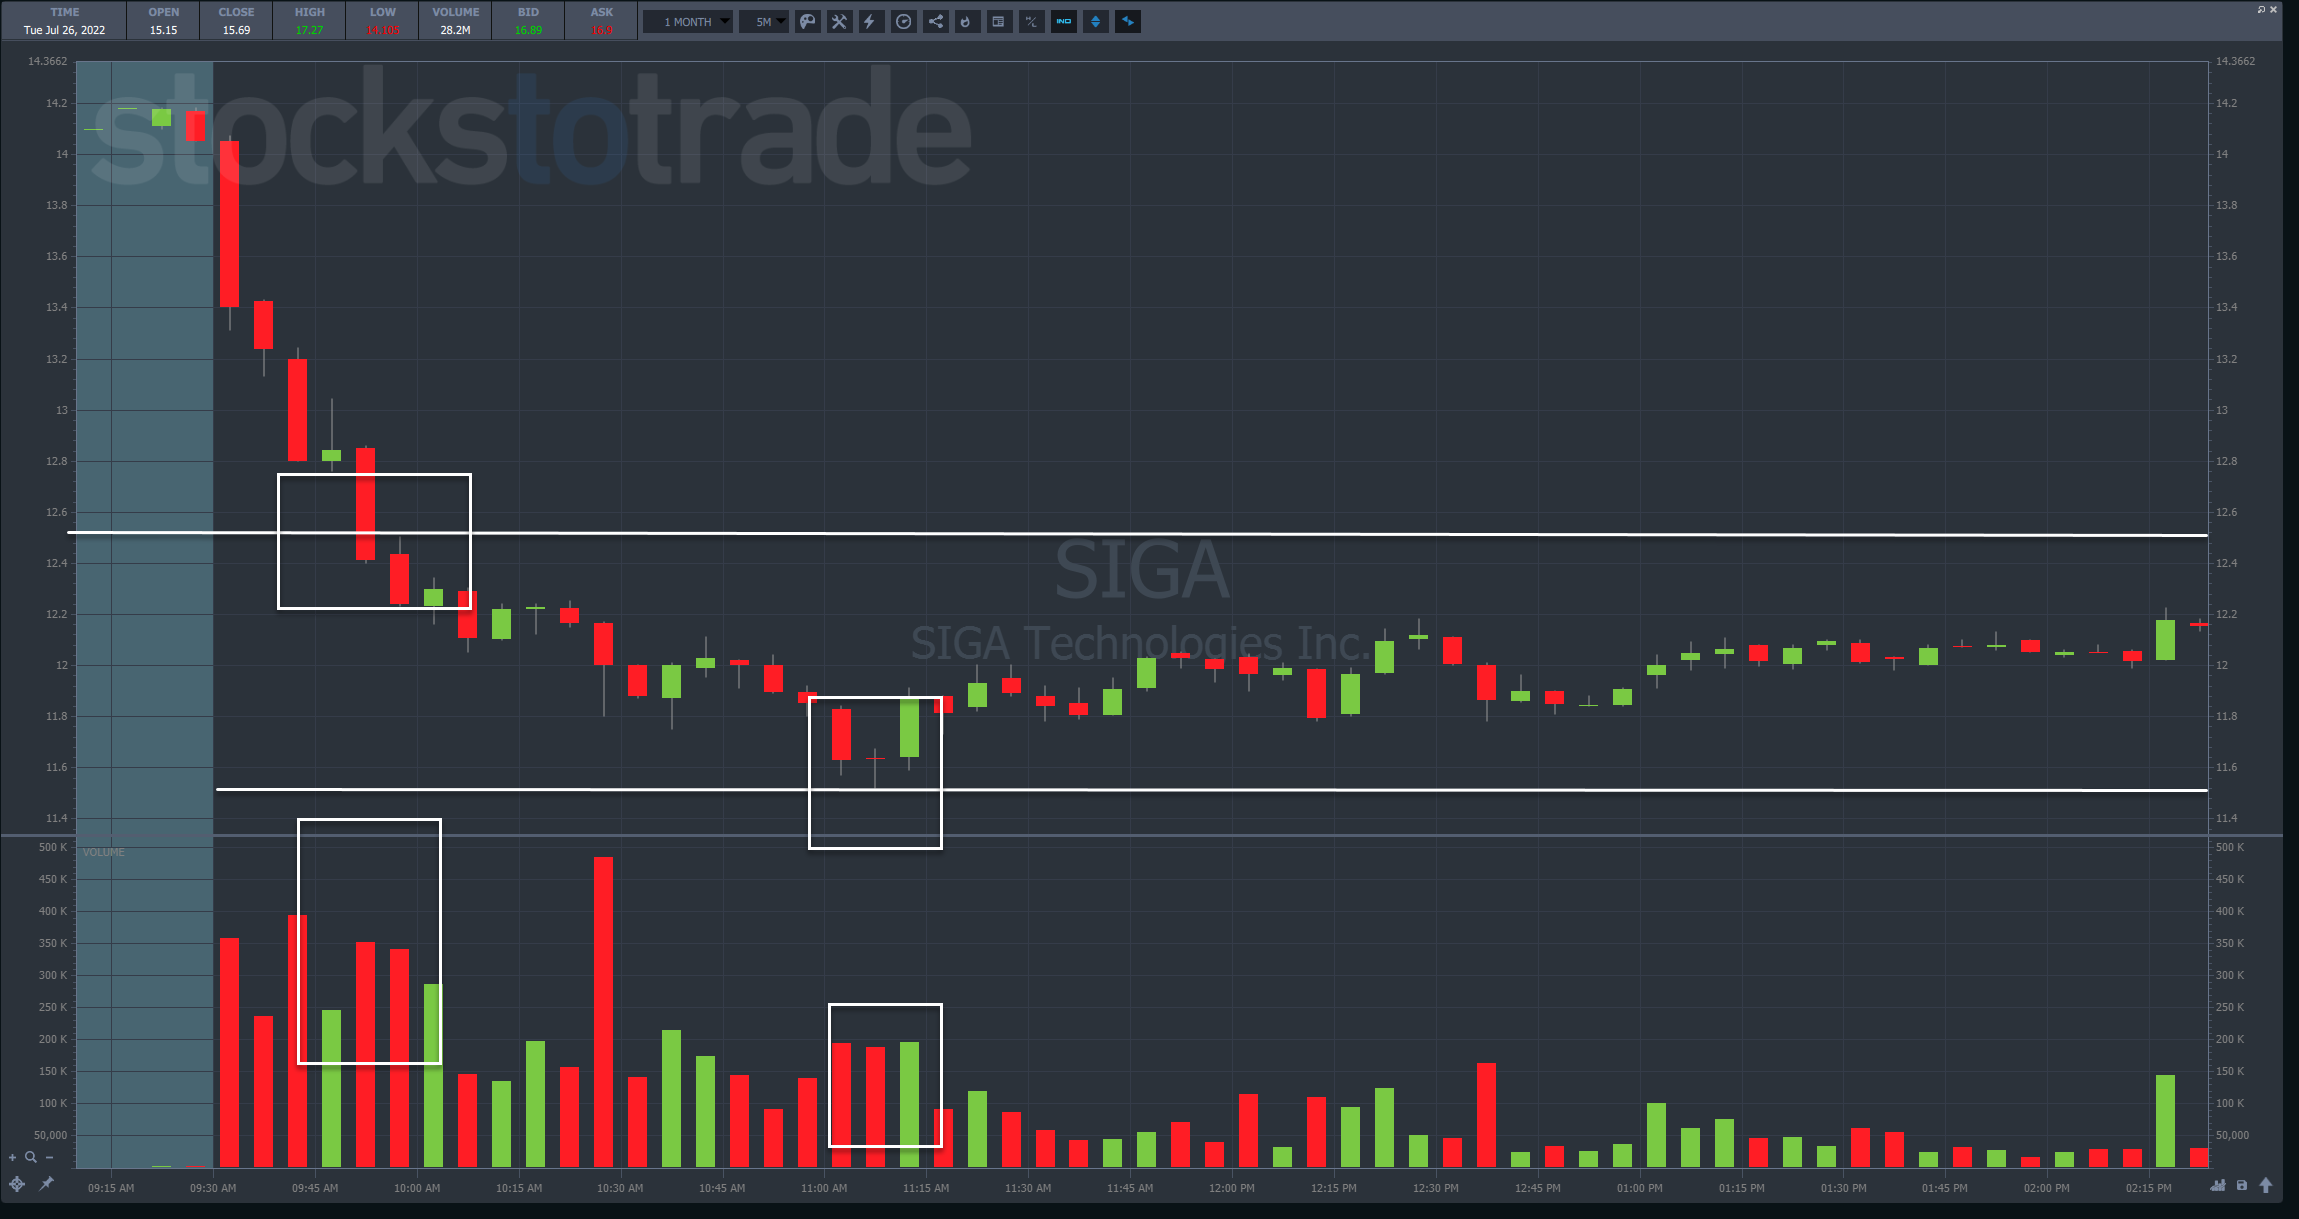
I highlighted the two areas were the stock met the support levels.
At the first spot, shares pushed through on heavy volume. There were no signs of slowing or an reversal.
At the second support, price glanced trendline and then moved away.
The volume here wasn’t great but was higher than the previous candlesticks.
Ideally, when a stock finds support, I like to see a pickup in volume and a green or truncated red candlestick.
Here’s a good example in Evofem Biosciences Inc. (NASDAQ: EVFM).

Notice how heavy the volume was on that large red candle, and then was quickly matched by the following two which held around $1.00.
That’s the kind of price action reversal I want to see on a support level.
It’s all about identifying when buyers show up.
Another way to do this is by using Level 2 data, especially on OTC stocks.
Level 2 data shows the current buy and sell orders. Market makers are a bit less likely to manipulate these on OTC stocks.
When I see a heavy amount of buyers or sellers, I can use that as another indication that a stock is about to hold the line.

In the example above, you can see a wall of buyers at $1.54, amounting to 4,500 shares compared to only 500 at $1.56.
This tells me that the stock will struggle to push through $1.56.
The Bottom Line
Each of these adds another weapon to your arsenal.
The most powerful traders use them with the trade patterns I teach.
Learn them, study them, and practice them.
–Tim
The post Buy Panic The Right Way appeared first on Timothy Sykes.