U.S. rail volumes in June weren’t close to where they would have been absent the pandemic, but for the most part they were better than in April and May, so at least they’re heading in the right direction. Whether that continues is, of course, a separate question, but the worst may be behind us.
emphasis added
 Click on graph for larger image.
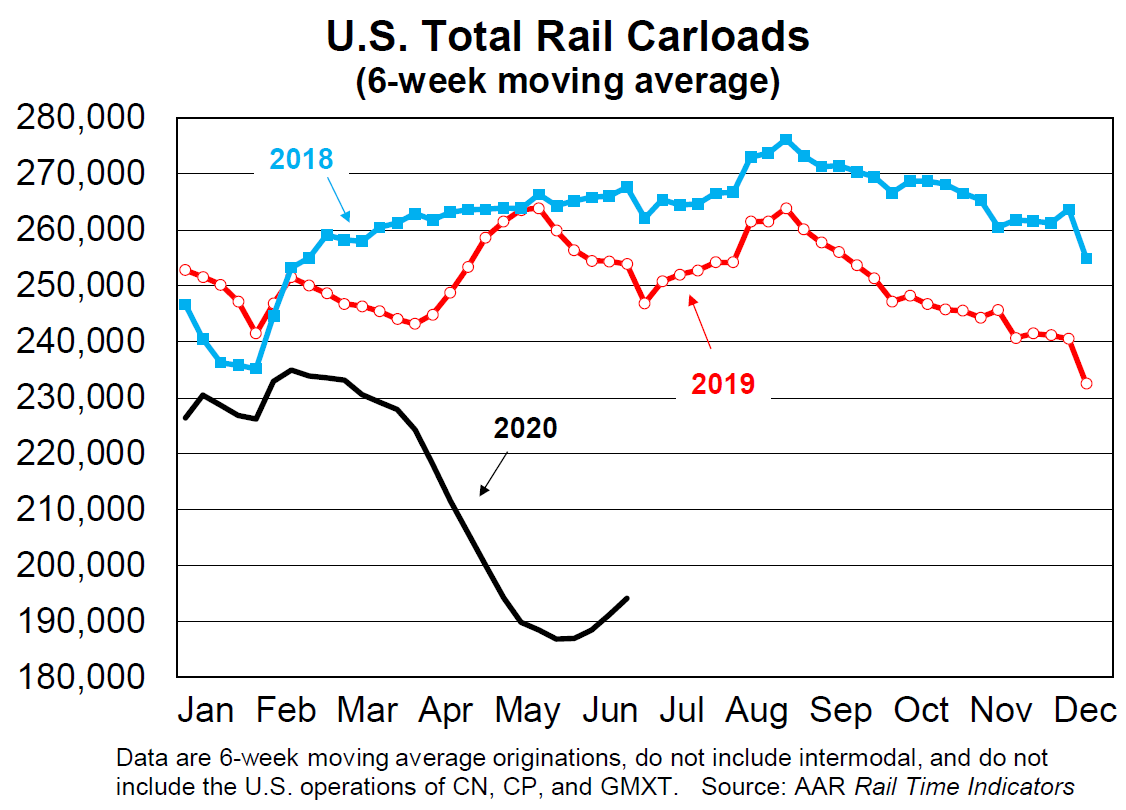
This graph from the Rail Time Indicators report shows the six week average of U.S. Carloads in 2018, 2019 and 2020:
Total originated U.S. rail carloads fell 22.4% in June 2020 from June 2019, a troubling result but better than the 25.2% decline in April and 27.7% decline in May. Average weekly total carloads in June were 198,564, the third lowest of any month in records going back to January 1988. Of
 The second graph shows the six week average of U.S. intermodal in 2018, 2019 and 2020: (using intermodal or shipping containers):
U.S. intermodal originations were down 6.6% in June 2020 from June 2019, their smallest percentage decline since January 2020 and much better than the 13.0% decline in May 2020 and the 17.2% decline in April 2020. An average of 251,233 containers and trailers were originated each week in June, the most since November 2019 and up from a recent low of 219,085 in April 2020.
Note that rail traffic was weak prior to the pandemic.