Tesla marked down the selling price of the Model 3 twice this week! In a humorous twist, $69,420 shows up as the list price. Good ol’ $420. Funding secured. We almost miss all those bizarre tweets. Article continues below.
News Bulletin
If you are interested, we have been planning a wonderful Technicians Day TODAY, Saturday October 17th. I will be opening the presentation, while Andrew Cardwell, nicknamed Dr. RSI by John Bollinger, will present some of his RSI reading strategies. Dwight Galusha, CMT and Barry Powley CFA, CMT will both present some current market thoughts based on their charts. Lastly, Tom McClellan of McClellan Oscillators will bring us some of his A/D work and some cycle patterns he is monitoring closely.
It is probably the fastest 5 hours in TA. Remarkably, the event is $25 Cdn or less than $20 US for the day. Wowza. But it is Saturday only!
Thanks!
Changes in the Car Charts
One of the reasons that we are starting to see some price reductions might be because some of the mainstream car manufacturers’ sales are starting to respond, as they introduce new electric models and the charts are starting to break out.
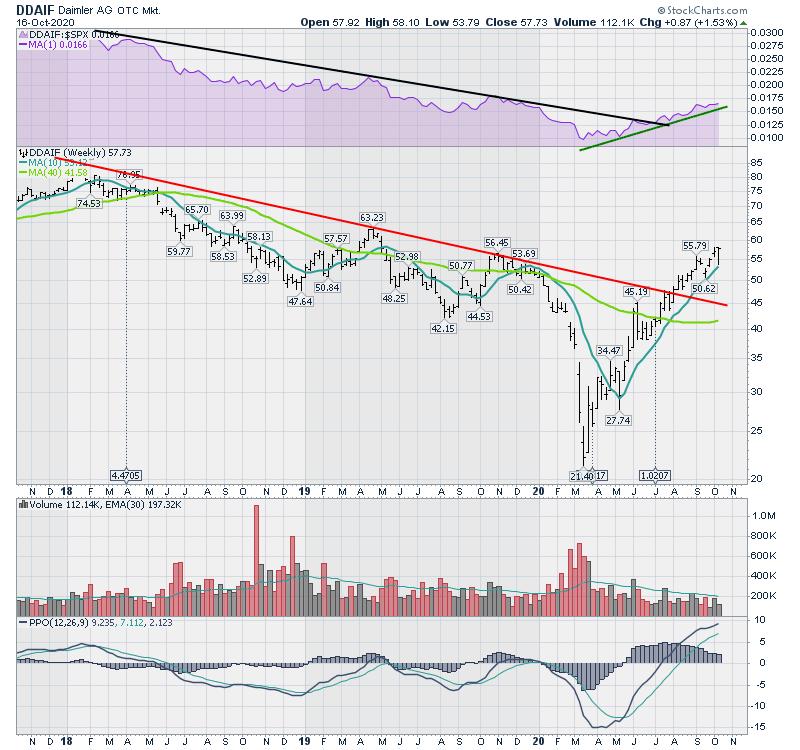
Daimler/Mercedes (DDAIF)
Mercedes hit a new 52-week high last week and closed with a higher close this week. The stock has broken through a thirty-month downtrend and is improving. The relative strength (in purple) is not at new 52-week highs yet, but continues to outperform since the lows in March. The PPO is the highest wave in three years, suggesting some new momentum coming in. Definitely one to keep an eye on.
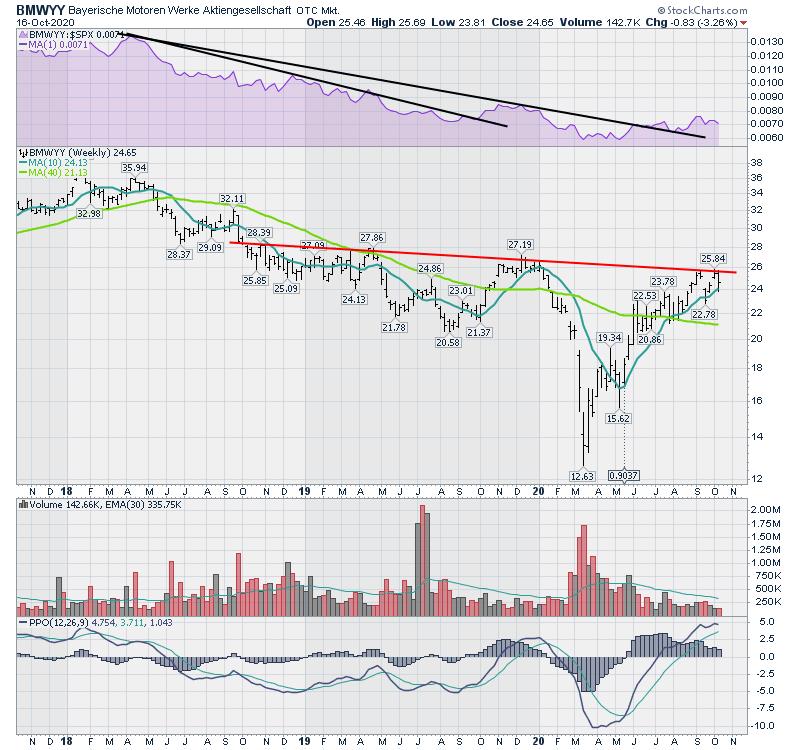
BMW (BMWYY)
BMW continues to find resistance at the downtrend line. It would not take much to push through, and this week it made the fourth attempt in a few months to do so. Like the Daimler chart above, the PPO wave is the highest in three years, suggesting some real momentum. The wide-ranging price action this week suggests some indecision. A break above $26 marks the 2020 highs and a break above $27.19 is a new 52-week high.
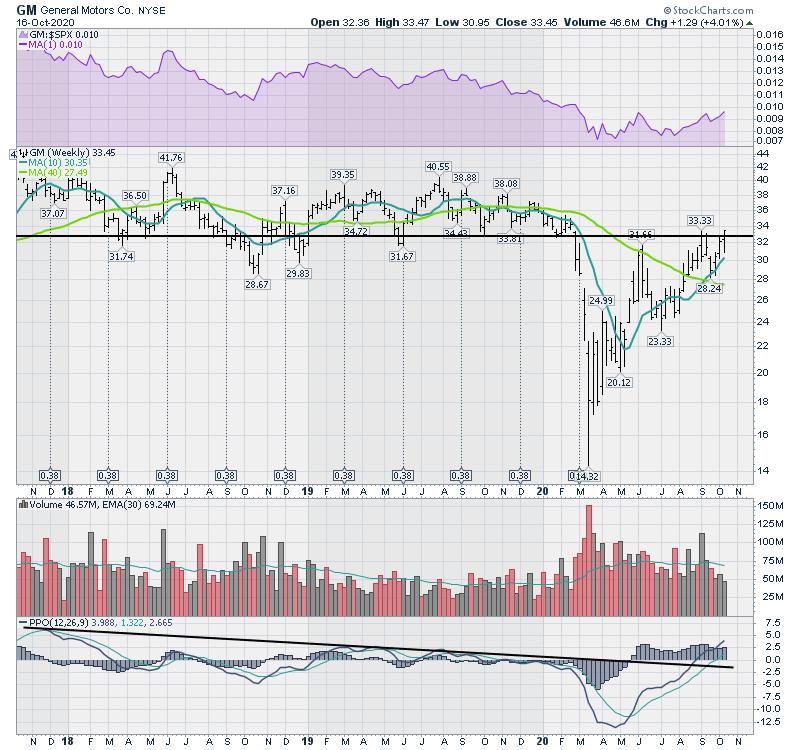
GM
General Motors closed at a post-COVID high this week. It was also an important support/resistance line on the chart. The PPO has surged to new 30-month highs, suggesting a new level of momentum. The relative strength (purple) has broken a one year downtrend line (not shown) and is now making higher highs. 6-month relative strength highs are a good place where the stock may be starting to attract attention of institutional investors.
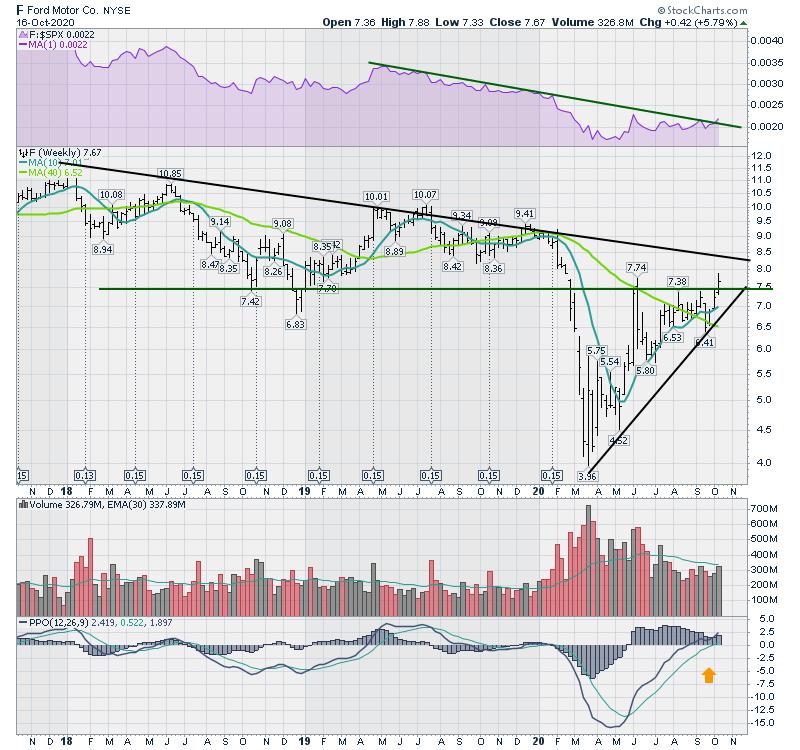
Ford (F)
Ford is a timely chart, as they announced they were halting production on some electric cars due to fires while charging. What’s a little heat in the kitchen? Regardless of the news, the stock chart made a couple of noteworthy changes. First of all, the downhill slope on the purple relative strength broke for the first time! While price has not broken the multi-year downtrend, the stock did break and close above an important support-resistance line. The PPO has started to surge up while above zero. Volume was increasing for the last two weeks. All little bullish clues.
Tesla (TSLA)
OK, back to Tesla. While I have trouble envisioning Tesla dropping hard with so many institutional investors riding Elon’s marketing, the chart is starting to show a few subtle clues. The relative strength line is parabolic as TSLA moved up 1000% in one year. I usually try to find a method for helping with harvesting some profits, and both the parabolic RS line and the PPO line are being broken. While Tesla is still working higher and closing in the top of the range, it has also been at a resistance level for the last 4 of 6 weeks. That doesn’t mean Tesla will fall, but, for a few institutional investors, its a great place to take some money and rebalance the portfolio. I think a few portfolio managers are on record as rebalancing some Tesla down to a more moderate weight in their portfolios.
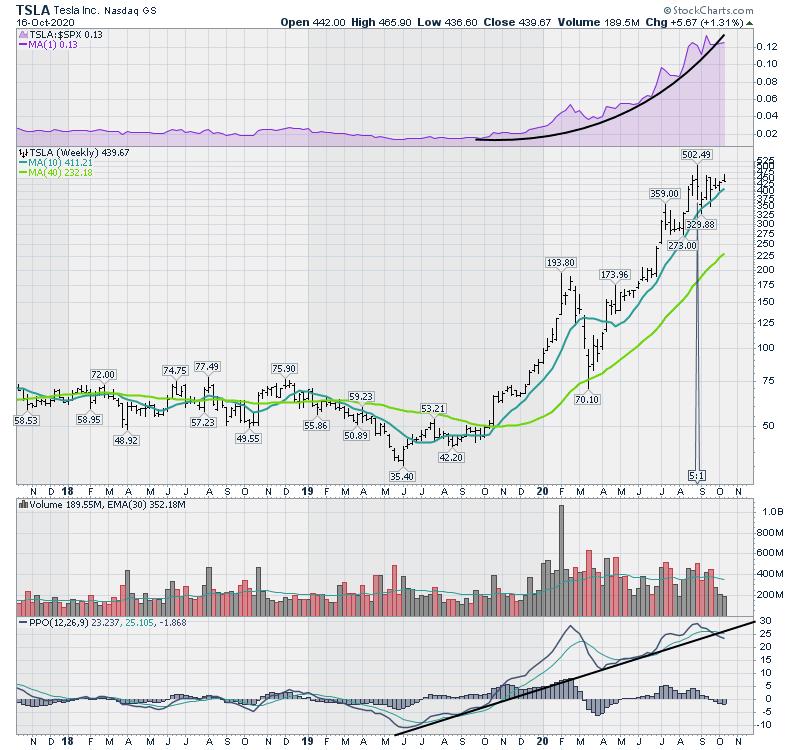
So, while Tesla starts to adjust MSRP’s downward and other car charts are trying to break out, this might be the inflection point for the electric engine becoming more mainstream. It hasn’t been mainstream yet. Ford is looking to bring electric power out in the F150 truck.
So is Tesla in trouble? The momentum is starting to slow from a very high level, but that doesn’t mean drop. It’s too early to tell how much this changes, but it is definitely worth watching how institutional investors respond when there are 50 new models with better distribution networks competing against their lineup. It might not be the final top, but even Elon’s rockets return to earth before the next takeoff.
Start your engines! This race is just beginning.
News Bulletin
If you are interested, we have been planning a wonderful Technicians Day TODAY, Saturday October 17th. I will be opening the presentation, while Andrew Cardwell, nicknamed Dr. RSI by John Bollinger, will present some of his RSI reading strategies. Dwight Galusha, CMT and Barry Powley CFA, CMT will both present some current market thoughts based on their charts. Lastly, Tom McClellan of McClellan Oscillators will bring us some of his A/D work and some cycle patterns he is monitoring closely.
It is probably the fastest 5 hours in TA. Remarkably, the event is $25 Cdn or less than $20 US for the day. Wowza. But it is Saturday only!