
(Financial) Markets rotate, that’s a given. When we look at the stock market, we call it sector rotation, which is probably the most widely-used term. But there is definitely also rotational action going on in other markets or cross assets. Think in terms of country or regional stock market rotation, or currency rotation. Alternately, as I would like to address today in this article, think of Asset (class) rotation.
People who watch my weekly Sector Spotlight show will know that I look at the rotation of asset classes on a regular basis using Relative Rotation Graphs. It’s a great visual aid to get a handle on how money is rotating in and out of various asset classes.
What is an Asset Class?
With regard to the definition of asset classes, mine is pretty pure. There simply are not too many different asset classes. In the pre-defined RRG for asset classes, I use Stocks, Government Bonds, Corporate Bonds, High Yield Bonds, Real Estate and Commodities. The chart also holds $USD for reference purposes.
Some people will argue that Small-Cap stocks is an asset class, or Gold is an asset class, or Emerging market stocks, etc. For me, Small-Cap stocks and Emerging market stocks are part of the asset class “stocks.” That asset class can be subdivided into various broken-down groups, like regional for emerging markets or based on market capitalization like small caps.
The same is true with Gold. Gold is a precious metal, and precious metals are a subgroup of the asset class Commodities. Saying that Gold is an asset class would be the same as saying that Apple (AAPL) or Amazon (AMZN) is an asset class..
Anyway… my 2 cts 😉
Stocks vs. Bonds
In this article, I want to take a closer look at the rotation of stocks vs. bonds.
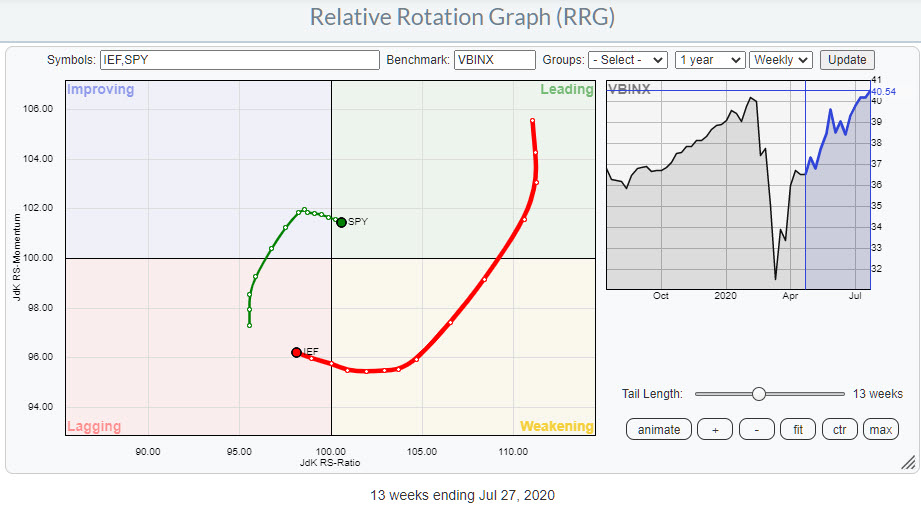
The Relative Rotation Graph above shows the tails of SPY and IEF vs. VBINX as the benchmark. As you can see, they rotate pretty much opposite to each other, which is normal. The downward, South-Western direction of IEF indicates weakness versus the positive tail, North-Eastern direction, for SPY.
With the tails now crossing over on the JdK RS-Ratio scale, that usually means a confirmation of the trend that is underway, but the fact that the tail for SPY rolled over already a few weeks ago while in improving, along with IEF curling up while inside lagging, causes some doubt about the sustainability of this trend (favoring stocks over bonds). That’s especially true when you combine the rotation above with the rotation for the same assets on a daily basis.
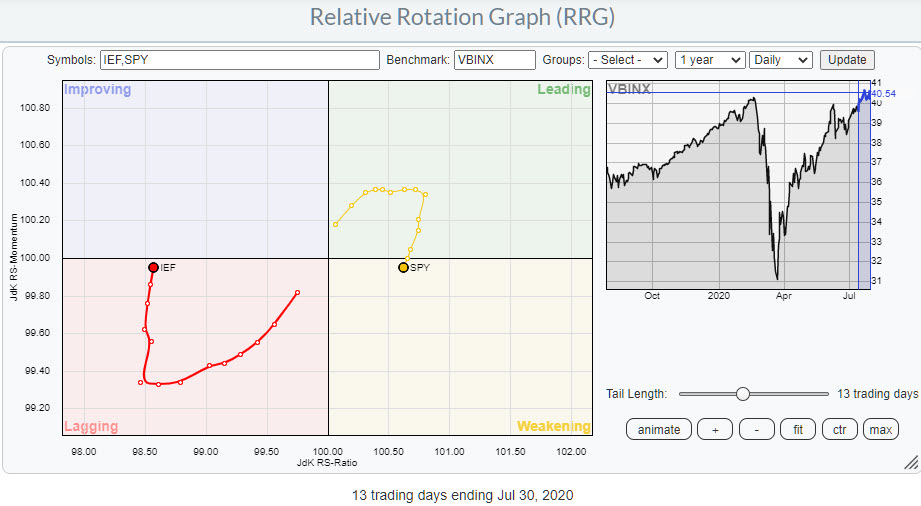
Here we see SPY crossing into the weakening quadrant after having rolled over inside leading 4-5 days ago. There’s also the opposite rotation for IEF, which is inside lagging and is almost crossing into improving after curling up 4-5 days ago.
If you look at the performances for SPY and IEF during these rotations, SPY has been leading most of the time. That makes it hard to “believe” negative rotations of SPY vs. IEF. However they can make a big difference when things go South.
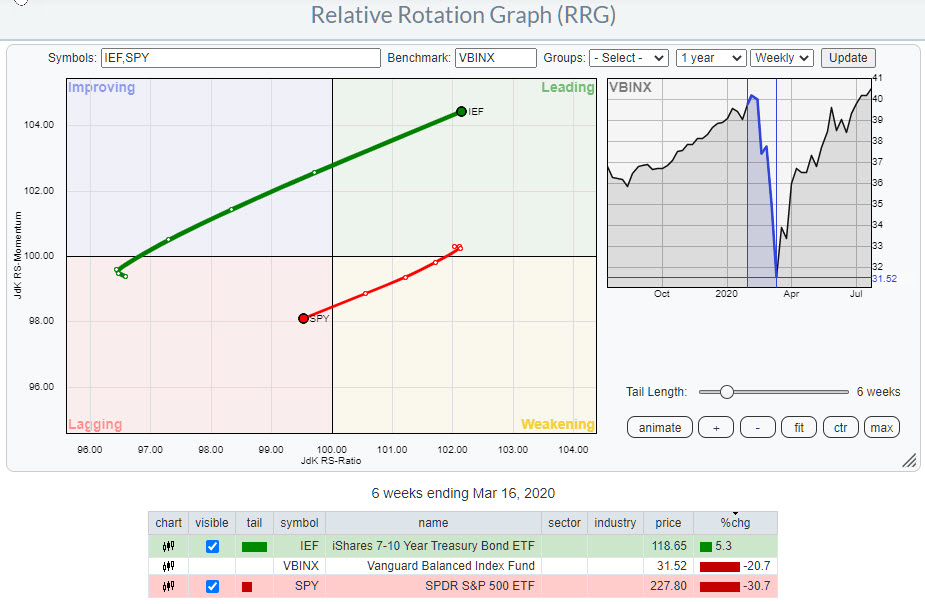
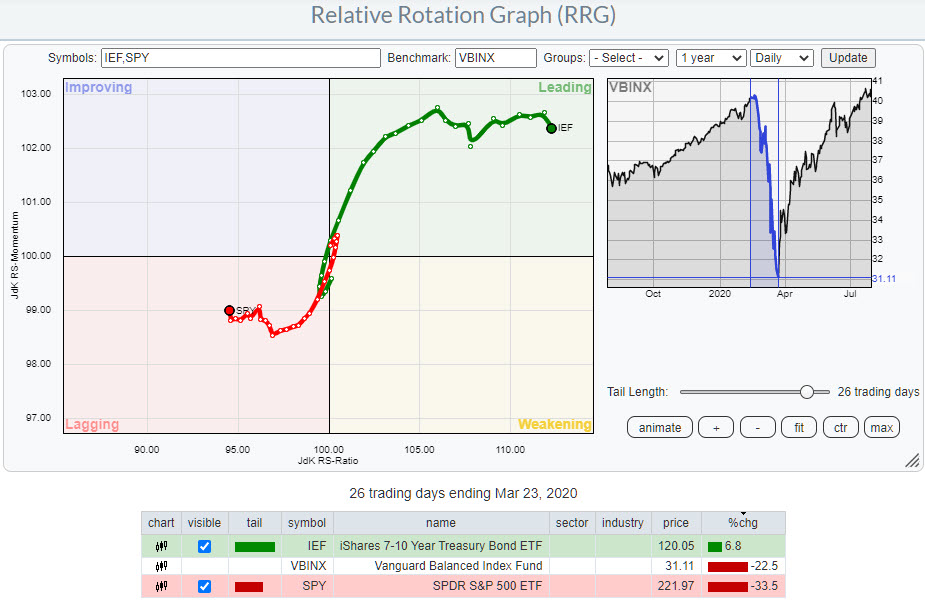
The two RRGs above show the rotations and the tails for SPY and IEF during the market decline in the “Corona Crash” and the outperformance of IEF over SPY during the opposite rotations. So I am not going to ignore such rotations.
Where does that leave us right now?
Weekly: SPY is still traveling West, but has started to fall, albeit slowly, on the JdK RS-Momentum scale, while IEF is doing the opposite. The fact that SPY is inside leading at the right hand side of the graph means that the long-term trend for this relation is still in favor of SPY.
Daily: SPY is at a negative RRG-Heading; it has crossed over into weakening and is now falling on both axes. Again, IEF is doing the opposite.
This combination of rotations on the daily and weekly RRGS suggests that, at least for the coming days/weeks, SPY will have trouble outpacing IEF. Eventually, the market will tell us if this was indeed a temporary rotation towards bonds and stocks will subsequently take over continuing the long-term trend outperforming bonds – or if a bigger rotation is starting.
It is simply too early to tell, but for now I prefer bonds over stocks.
Another observation that feeds this thought comes from the bond chart, which needs a bit of clarification.
There are many bond charts. Let’s say we want to analyze 10-year US bonds. We can analyze the yield ($UST10Y), we can look at individual bond prices with maturities between 7-10 years, we can look at an ETF that tracks those bond prices with maturity 7-10 years (IEF) or we can look at the 10-Year Treasury note futures.
At first they all look “similar;” of course yields inverse to bond prices and, for the “big picture,” it does not really matter what instrument you look at. But, when you want to take a closer look, you need to look at the instrument that really is the benchmark for all these tickers, and that is the T-note future. The futures market is pretty much where prices are “made” – everything else is based on those prices.
Every bond market maker will price individual bonds off the price of the future. These prices will result in the price for IEF, because it is a basket of bonds, and the generic yield is calculated off the future.
I had to think of this when I watched the price chart for IEF (and other bond ETFs) and was wondering whether what I saw was a break to new highs or not…
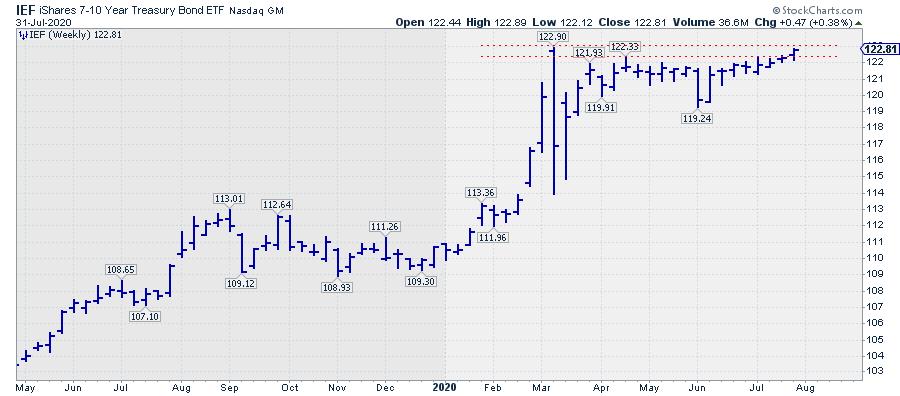
Here is the weekly chart for IEF showing a resistance area with a peak at 122.90. Should we include that or not? Is that the ultimate resistance level?
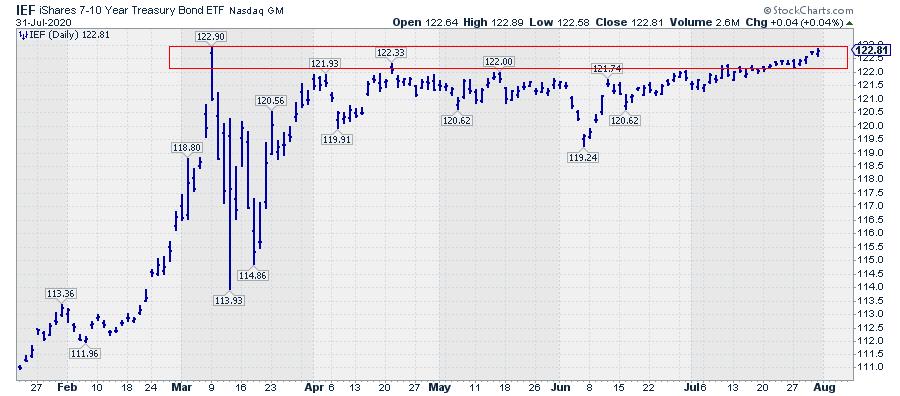
Here is the daily chart for IEF, showing the resistance area in more detail.
And here is the chart for the futures…
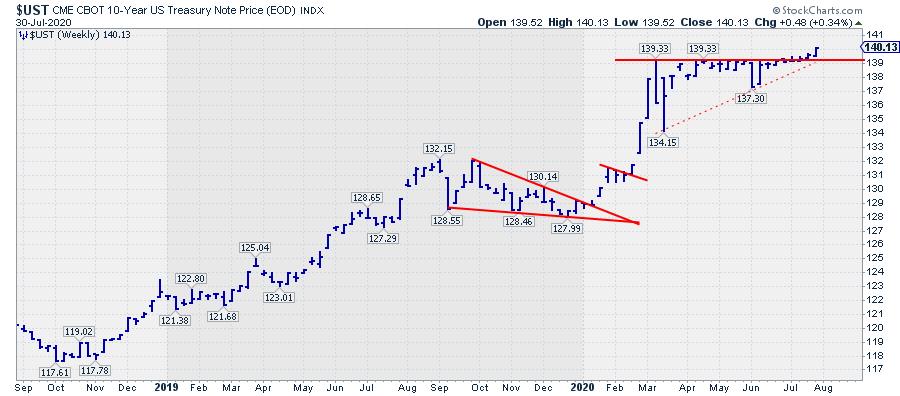
I would say that this is a pretty clear break of resistance. So the futures chart is confirming what I thought I was seeing on the ETF chart, which adds to the belief that Bonds are setting up for a new rally.
I am going to track this relationship closely in coming weeks, as I think it is crucial to the long-term positioning of stocks vs. bonds in portfolios.
#StaySafe, –Julius
My regular blog is the RRG Charts blog. If you would like to receive a notification when a new article is published there, simply “Subscribe” with your email address.