The oil market has the media spotlight, with projected prices continuing to rise. Shortages, inflation and economic growth have all been major factors in oil trending higher throughout this year. With gas at a 7-year high, pressure has been mounting on the Biden administration to ease the consistent price climb.
However, this leads to the current disagreement between the U.S. and OPEC (Organization of the Petroleum Exporting Countries). While the U.S and other countries have entertained the idea of releasing personal oil reserves to calm prices, OPEC has responded with a warning that if the U.S, India, China and South Korea all release oil, they will not ramp up their oil productions. They believe that the oil market will swing into a surplus cautioning haste on releasing too much oil.
From the inflation side, JP Morgan created a study on oil prices compared to equities adjusted through inflation, showing that, going back 20 years, if oil had followed equities percentage increase (excluding the Nasdaq index), oil would be priced near $115 per barrel. Currently, the price is $78 per barrel. From this standpoint, oil is still much cheaper compared to $115. However, with so many moving parts and potential manipulation from OPEC, it’s tough to gauge where price should be based on growing demand.
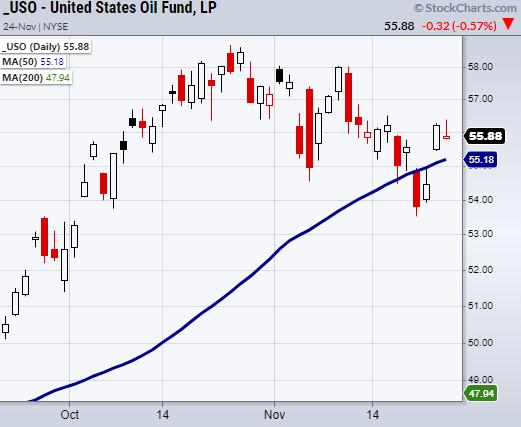
Pulling away from fundamentals, charting can add more perspective to oil’s short-term future. Above is a chart of United States Oil Fund ETF (USO). Currently, USO has made a second close over its 50-day moving average (DMA) confirming a bullish phase. Though it is within a recent downward trend, if USO can hold over its 50-DMA at $55.18 or its 10-DMA at $55.53, we could see it run back to highs near $59. On the other hand, if USO breaks down, watch the support area from $53.50 – 54.50 to hold.
Either way, consumers are looking for cheaper prices, which OPEC is hesitant to meet through adding supply. Therefore, it will be interesting to watch the oil market going forward if demand continues to outpace supply, thus putting pressure not only on travel and movement of goods but the current U.S administration.
Safe travels and have a Happy Thanksgiving!
Follow Mish on Twitter @marketminute for stock picks and more. Follow Mish on Instagram (mishschneider) for daily morning videos. To see updated media clips, click here.
Watch Mish on Making Money with Charles Payne below!
ETF Summary
- S&P 500 (SPY): 464.45 new support to hold.
- Russell 2000 (IWM): 228.26 support the 50-DMA.
- Dow (DIA): Watching 355.34 to hold.
- Nasdaq (QQQ): Watching to stay over the 10-DMA at 397.62.
- KRE (Regional Banks): 75.75 resistance area.
- SMH (Semiconductors): like this to stay over 300.
- IYT (Transportation): 270.89 support.
- IBB (Biotechnology): 150.21 new support.
- XRT (Retail): Sitting in support from prior trading range.
Forrest Crist-Ruiz
MarketGauge.com
Assistant Director of Trading Research and Education