Despite the long-term macro trends of higher interest rates, higher inflation and a hawkish Fed, growth stocks have managed to log some pretty decent gains in recent weeks.
I’ve spoken often on the importance of the FAANG stocks due to their outsized influence on our very growth-oriented equity benchmarks. (“As go the FAANGs, so goes the market!”) So I have definitely taken notice of the NYSE Fang Plus Index threatening to break out of a symmetrical triangle or “coil” pattern to the upside.
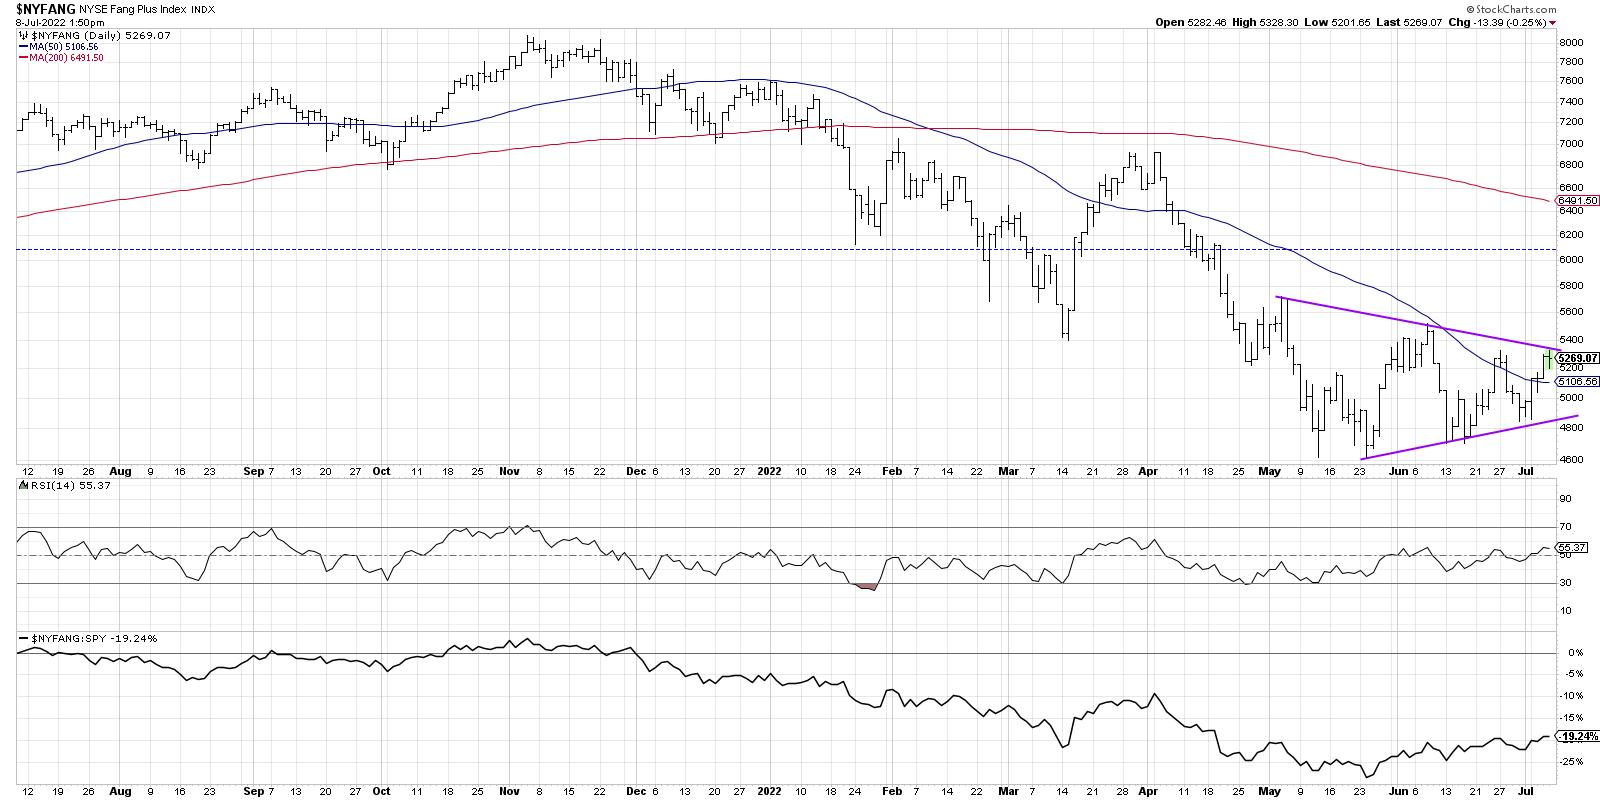
After making a new low every month in 2022 through May, the FAANG stocks made a higher low in June as part of a consolidation pattern. The $NYFANG index (which includes lots of other names like TSLA and TWTR) is now testing trendline resistance using the highs in early May and June. This pattern of lower highs and higher lows, revolving around a midpoint around 5000, mirrors the consolidation in the S&P 500 index around the 3800 level. Basically, buyers and sellers are in equilibrium, and the market is telling you were at about the right value for these indexes.
So what’s next?
A coil pattern is relatively straightforward, in that it reaches a natural end or “apex” as the two trendlines eventually converge. Usually about 2/3rds to 3/4ths of the way through the pattern, the price breaks out to either the upside or downside. Whichever ways the price resolves is the stronger direction of momentum. In general, the price will tend to follow the direction of the breakout as either buyers or sellers exert control over price.
The NYSE Fang Plus index is now testing the upper boundary of this pattern. If we get a valid breakout above the pattern next week, that could indicate renewed strength in growth stocks and, most likely, further upside for bonds as interest rates fall. If and when the price would instead break down through the lower boundary of the pattern, that would indicate a likely next leg down in the ongoing bear market phase of 2022.
Either way, this next move in the FAANG stocks will absolutely be the chart to watch!
RR#6,
Dave
P.S. Ready to upgrade your investment process? Check out my YouTube channel!
David Keller, CMT
Chief Market Strategist
StockCharts.com
Disclaimer: This blog is for educational purposes only and should not be construed as financial advice. The ideas and strategies should never be used without first assessing your own personal and financial situation, or without consulting a financial professional.
The author does not have a position in mentioned securities at the time of publication. Any opinions expressed herein are solely those of the author, and do not in any way represent the views or opinions of any other person or entity.