
By far the most watched Relative Rotation Graph is the one that shows the rotation for the 11 S&P sectors, and for good reasons. It shows very clearly where the strengths and weaknesses in the various areas of the market are.
But we have to realize that some of these sectors are dominated by one or a few meg-cap stocks which can distort the underlying picture. Best known of course are AAPL and MSFT in Technology, AMZN in Consumer Discretionary, and FB and GOOG in Communication Services.
The Equal Weight version of this RRG does a better job of showing the underlying rotations of the broader based market/sector. So despite the fact that the cap-weighted sectors and their rotations are important I do like to keep an eye on the Equal Weight version to stay connected to what’s happening just below the top of the market.
Making the connection

The image above shows the cap-weighted RRG at the top and the Equal Weight RRG below that. The Cap weight RRG uses SPY as the benchmark, which is also a cap weighted index while the Equal Weight RRG uses RSP which is the equal weight version of SPY. So we have apples and oranges at all levels.
I have tried to connect Equal- and Cap-weighted sectors with each other using dotted and shaded curves as good as I could without hurting the image too much. Although you probably need a desktop screen screen to get both images in full view to see all connections.
Let’s start with the first observation regarding both benchmarks. SPY, as we all know, has broken above its early 2020 peak and is now pushing further to new all-time-highs. RSP, the Equal Weight counterpart is not there yet. This is the first message that mega-cap stocks have pushed SPY above its resistance while their is a large group of stocks that are not there yet, in many cases not even close.
Moving to the sectors, let’s see where we can see similar or different rotations on these RRGs and figure out if they can give us some additional information.
Energy
XLE has just crossed back into the lagging quadrant after a strong momentum based move through improving, but at the end of the day the move was not strong enough to make it all the way to the leading quadrant. RYE is going through a similar pattern and is heading towards the lagging quadrant inside improving.
IMHO these rotational patterns are very similar and both are telling us that Energy is one of the weakest, if not THE weakest sector in the S&P at the moment and the negative RRG-Heading suggests that more weakness lies ahead.
Utilities
XLU is moving slowly higher on the JdK RS-Momentum scale but not gaining on the JdK RS-Ratio scale while still far to the left of the plot. RYU is on a similar path so both versions are sending the same message.
Financials
XLF is inside the improving quadrant but rolling over downwards and heading back to the lagging quadrant again since three weeks or so. RYF is positioned slightly more to the right but also inside the improving quadrant and on a similar rotational path. Hence, a similar message and also a sector that is unlikely to outpace the benchmark.
Real-Estate
Both XLRE and EWRE are showing a similar “hook” back to the left and a negative RRG-Heading after a short period of improvement. Indicating that a further underperformance for Real Estate stocks is likely in coming weeks.
Consumer Staples
XLP as well as its Equal Weight counterpart, RHS, are inside the lagging quadrant and moving higher on the RS-Momentum scale but not gaining any relative strength (moving higher on the RS-Ratio axis). Until this sector starts to gain on the RS-Ratio scale we’ll have to treat this as a recovery within a relative downtrend that is still intact.
Healthcare
The Healthcare sector with cap weighted XLV and Equal weighted RYH is the first sector that is showing tails in different quadrants. XLV is inside lagging while RYH is still inside weakening. The shape of the tail on the other hand is largely similar for both ETFs.
A look at the price charts of both ETFs with relative strength versus their respective benchmarks shows a sector that has broken to new highs (positive) but relative strength failing to catch up. The big difference is that the relative weakness for XLV is much better visible than for RYH. All in all the outlook for this sector is not strong, the rotational trajectory is heading further left which indicates a, further, loss of relative strength while the recent up-tick in relative momentum already seems to start fading.
Industrials
XLI is inside the improving quadrant and just started to move higher again on the RS-Ratio scale after a few weeks showing a loss of momentum. RGI is solidly inside the leading quadrant and moving at an RRG-Heading around 90 degrees.. This means a steady further improvement of relative strength vs the benchmark but without acceleration/momentum. In other words a steady relative uptrend.
With the Equal weight ETF leading the cap weight ETF in terms of relative strength, this suggests that the strength for the Industrials sector is coming from a broad(er) base which IMHO makes it a reliable move.
Communication Services
This is the first sector where the RRG-Heading on the tails starts to diverge. Both ETFs are inside the weakening quadrant after a rotation through leading. EWCO has just started to curl up again, moving back up towards leading while XLC continues at a negative RRG-Heading.
A quick look at mega-caps FB and GOOG shows that their relative strength has been flat, at best, lately, which means that the improvement for EWCO is coming from the second tier names in this sector.
That is a sign of strength for the second tier stocks, especially as they are apparently so strong that they can overcome the relative weakness of GOOG and FB which is putting pressure on the rotation of XLC.
When FB and/or GOOG can pick up some relative strength again, that would mean a serious boost for the Communications sector.
Materials
XLB is inside the leading quadrant but moving straight down, meaning a, rapid, loss of relative momentum. So far the relative trend (RS-Ratio) has not been harmed too much yet. The EW equivalent RTM is also inside the leading quadrant but more to the right and still gaining on the RS-Ratio scale while also losing relative momentum.
LIN is the biggest stock in this sector at 18%
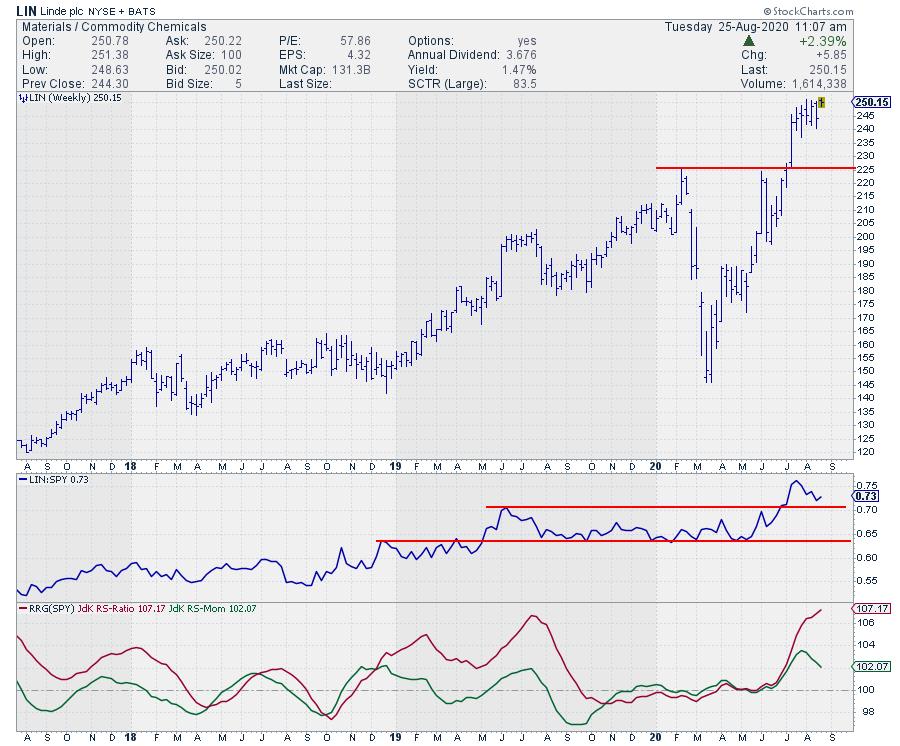
Looking at the start we can see why XLB is losing relative momentum at a faster pace than RTM. After the combined break in price and relative strength, price stalled and started to move sideways which caused relative strength to come off.
The good news is that on both charts LIN is holding up well above the breakout levels which makes this an interesting candidate to pick up once LIN drops back towards the old resistance level, now support, on the price chart. Ideally somewhere in the $230-$235 range.
Once that happens and relative strength can pick up again, the Materials sector can continue to play a leading role inside the S&P 500.
As a matter of fact, measured on the RS-Ratio scale, RTM is already the strongest sector in the S&P 500.
Consumer Discretionary
XLY and RCD are both inside the leading quadrant but XLY is moving straight lower on the RS-Momentum scale, but not losing much relative strength, while RCD came into the leading quadrant at an RRG-Heading between 90-180 degrees. RCD then stabilized and is now moving due East. This means a stable relative uptrend without acceleration nor deceleration.
Clearly the Elephant in the room here, literally, is AMZN. The chart continues to amaze people and despite a small pause recently it looks as if it is only taking a breather before moving further.
Sometimes trends need a bit of rest you know, otherwise they would bend over backwards like a wave in the sea …

The pause in the rally has caused the RS-line to move sideways as well, and obviously with such a high weight in the sector that puts pressure on the relative strength for the sector as a whole.
The second largest stock in the Consumer Discretionary sector is HD
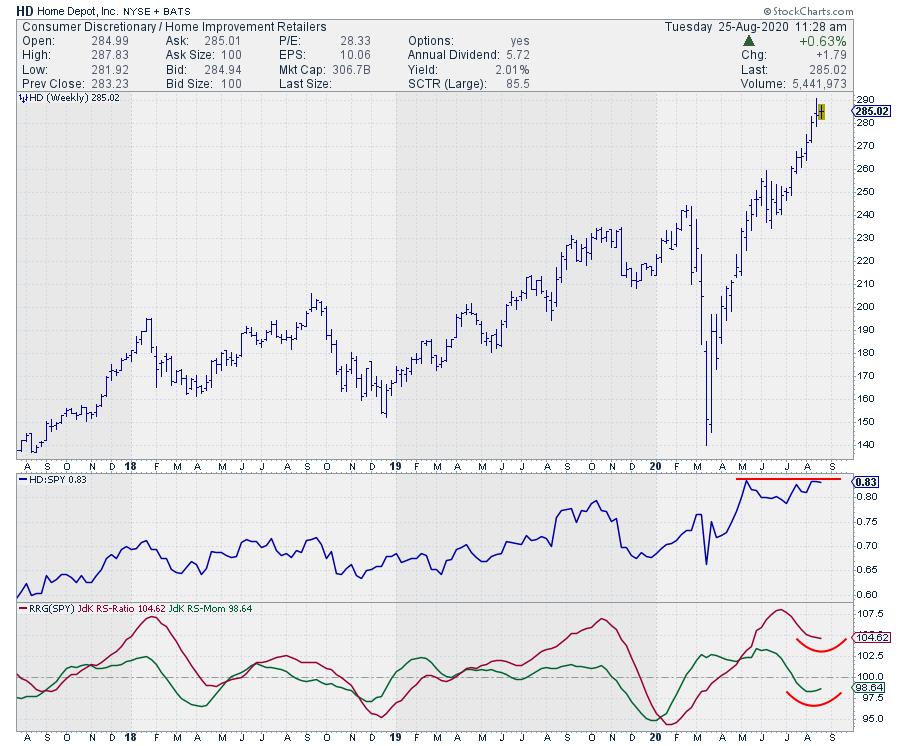
Here we also see a flat RS-Line since the peak in RS on 11 March which also pressures the relative strength for the sector as a whole.
The pressure from these two big names is not present in RCD which is still moving higher on the RS-Ratio scale without a loss of relative momentum.
With both AMZN and HD still in strong trends a break above their respective peaks in relative strength will be the sign for a continuation of the outperformance for XLY.
Technology
While XLK is still the highest ranked sector in the cap weighted universe and the tail just rotated back into a 0-90 heading after dipping into the weakening quadrant, that cannot be said of its equal weight counterpart RYT.
RYT is also inside the weakening quadrant but moving due West which is almost opposite of XLK. The clear culprit for this disconnect between XLK and RYT is AAPL.
In the EW universe RYT lost its top ranking a few weeks ago and with RYT moving West and sectors like RCD, RGI, and RTM moving East it seems only a matter of time before Tech will be the fourth or fifth strongest sector.
The good news is that RYT is still above 100 on the RS-Ratio scale and still have room to complete a rotation back up to leading while inside the weakening quadrant.
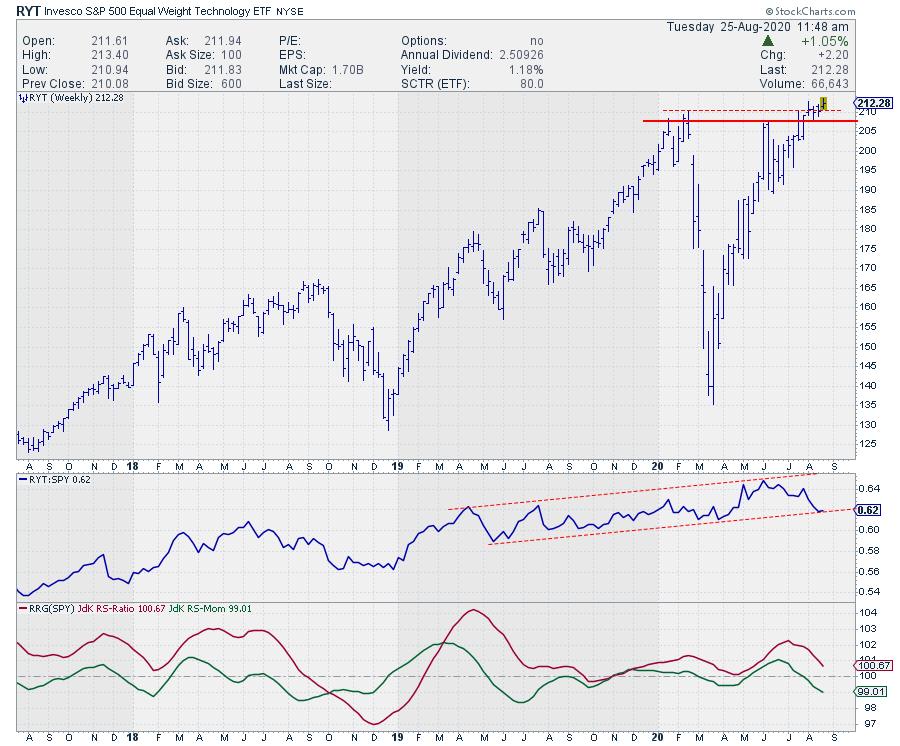
In order for this to happen, the recent break above resistance should now start to accelerate, which in its turn would give a boost to the RS-Line which is at the lower boundary of its rising channel. A combined pick up in momentum for price and RS will put RYT back on track as one of the stronger sectors.
So the risk is clearly in AAPL. As long as AAPL continues its climb, XLK will continue to do well, but that does not necessarily go for RYT. But this also goes the other way.
If AAPL starts to decline that does not have as big an effect on RYT and this knowledge can help you in portfolio construction when you trade these ETFs.
The trend in Technology is still up, both in terms of price and relative strength. And the only thing we can do is monitor these trends closely and try to pick up any down turn as early as possible.
But in terms of Risk Management AAPL is becoming a real issue inside XLK. If it goes for whatever reason and it goes fast, then most people will be too late to respond. If you swap XLK for RYT you will still have the desired allocation to the tech sector and still hold a portion of AAPL. But the impact of any decline in AAPL will not hurt as muchas it will hurt while holding XLK.
Just a thought …
#StaySafe, –Julius