In a yet another week where we witnessed a gush of liquidity continuing to chase the equities, the Indian equity markets saw a buoyant week and ended once again with week. The trading range of the week remained wider on the expected lines. The headline index oscillated over in a wide range, and by the end of the week, ended with a strong gain of 561.85 points (+5.86%). What we are witnessing right now is one of the sharpest bear market rallies of our times amid a risk-on built up.
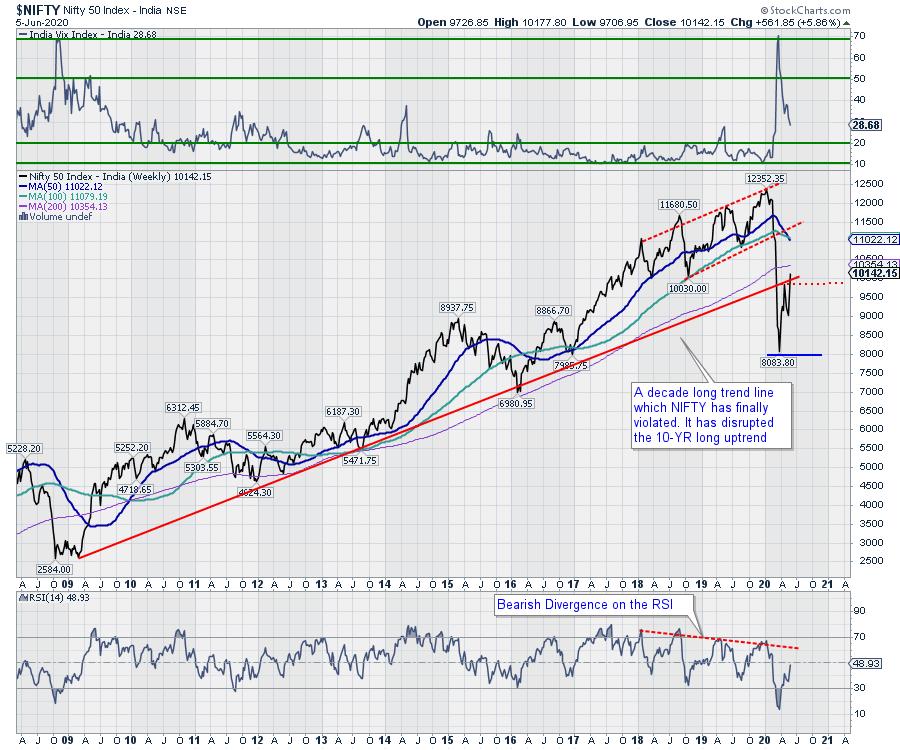
Whenever a risk-on setup occurs and when liquidity starts to chase the equities, typically two things happen. First, we see that there is sometimes a seeming disconnect between the valuations and the factual macro-economic setup; and second, we often see major technical setups and levels getting violated. In the present case, where the Index has gained in 7 of the previous 8 sessions, we have seen NIFTY penetrating effortlessly inside the 11-year old pattern resistance without halting there even once. The rally, still, however remains a bear market rally as of now as the Index trades below the 200-Week MA.
We may once again start the week on a positive note. The trading range for the coming week is expected to remain wider just like the previous two weeks. The levels of 10200 and 10375 will act as strong resistance; supports are expected to come in at 10000 and 9810 levels.
The weekly RSI is 48.93; it remains neutral and does not show any resistance against the price. The weekly MACD has shown a positive crossover; it is now bullish and trades above its signal line. The PPO is positive. A white body has emerged on the candles. It shows the direction of the trend that was prevailing throughout the week.
The pattern analysis shows some lagging indicators turning bearish. The 50-Week MA, which presently stands at 11022 has cut the 100-Week MA from above which is currently at 11078. The Index also trades below all its moving averages, and especially below the 200-Week MA which is 10353.
The volatility continued to decline through the previous week. The India Volatility Index, INDIAVIX, came off by 5.10% to 28.68. Given the present risk-on setup, we need to take note of a couple of things. There are fair chances that we may see the markets going in for some more up move, and in the process, violate few technically important levels. In such a case, looking for targets would be irrelevant and instead, traders should focus more on strictly trailing their stop-losses if they choose to follow the rally.
Also, there are chances that the penetration of the 11-year old pattern resistance that exists in the form of a rising trend line may remain temporary in case of some consolidation happening in the markets. We also reiterate that the present rally should note be construed as a beginning of a fresh bull trend until and unless the NIFTY moves above 100- and 200-week MA. As of now, the Index trades below all its key moving averages. A cautious approach should be continued for the coming week as well as the bear market rallies can be sharp and equally deceptive.
Sector Analysis for the coming week
In our look at Relative Rotation Graphs®, we compared various sectors against CNX500 (NIFTY 500 Index), which represents over 95% of the free float market cap of all the stocks listed.
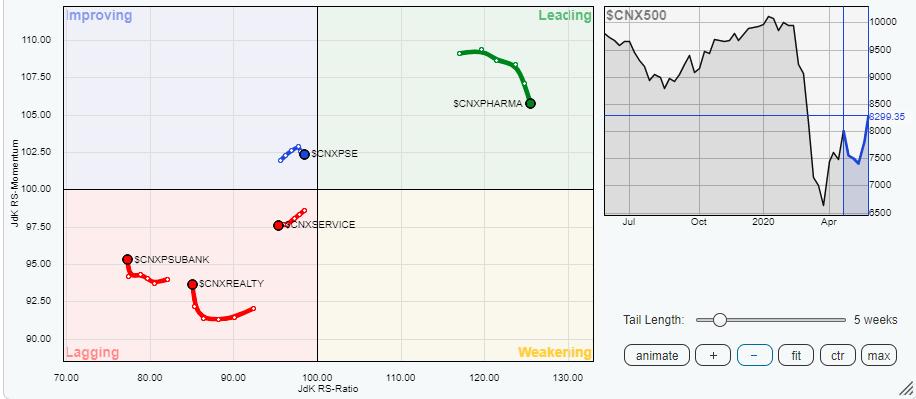
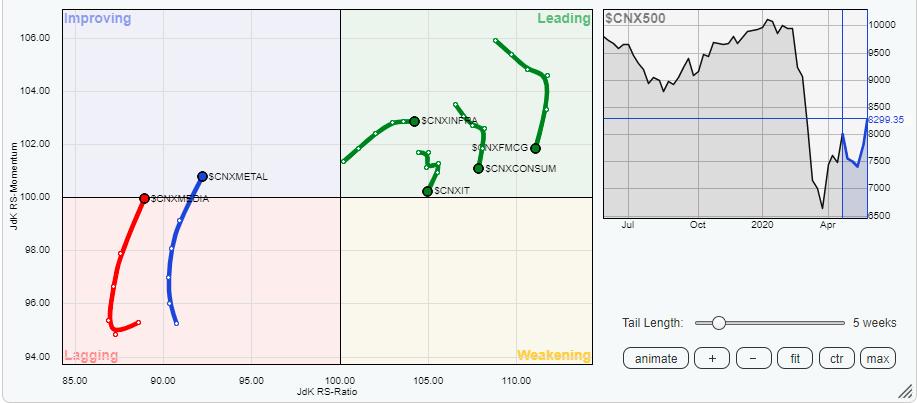
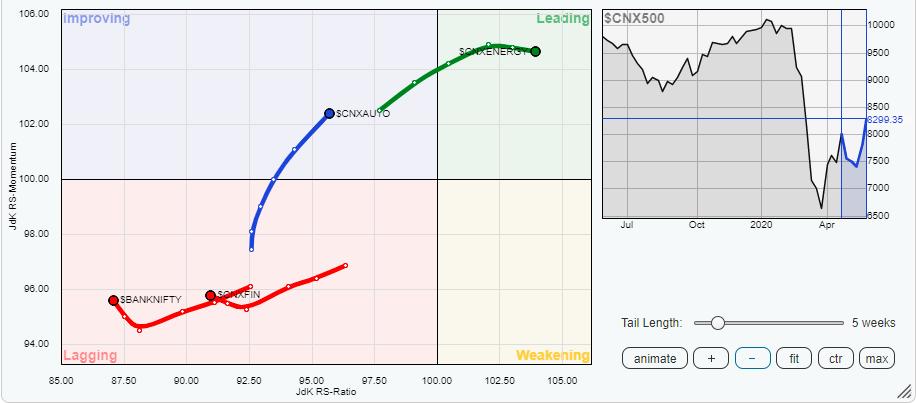
The review of Relative Rotation Graphs (RRG) shows that the FMCG and the Consumption indexes are losing ground steadily despite remaining in the leading quadrant. This is evident from the rate of the diminishing relative momentum that it is showing while moving southward. A similar trend is observed in the IT sector index as well. The contribution of these group in the relative outperformance against the broader markets is expected to diminish. The NIFTY Energy and the Infra pack continue to stay firm in the leading quadrant. The Pharma group also stays in the leading quadrant but shows some mild paring of momentum. However, it is likely to relatively outperform the broader NIFTY 500 index along with the Infra and the Energy groups.
The Commodities Index, which is in the improving quadrant is seen moving firmly towards the leading quadrant. The NIFTY Metal and the Media indexes appear to have almost completed their bottoming out process and appear to have entered the improving quadrant.
The services sector continues to move further in the lagging quadrant, it will continue to relatively underperform the broader markets. The Banknifty and the PSU Bank index have halted their downsides. While they are far from getting bottomed out, they may be seen consolidating their performance against the broader markets along with the Realty index.
Important Note: RRG™ charts show the relative strength and momentum for a group of stocks. In the above Chart, they show relative performance against NIFTY500 Index (Broader Markets) and should not be used directly as buy or sell signals.
Milan Vaishnav, CMT, MSTA
Consulting Technical Analyst,