The week that went by saw the markets trading very much on the analyzed lines. It was mentioned that if the NIFTY can keep its head above 18300-18400 levels, there were chances of it testing its lifetime high point of 18604 and attempting a breakout. While moving on the anticipated lines, the NIFTY did move past the 18604 levels and has tried to play catch up to the NIFTY Bank index by staging a breakout. The trading range widened; the index oscillated in the range of 522 points over the past five sessions. Although the markets did witness a corrective move toward the end of the week but still managed to end with a net gain of 183.35 points (+0.99%) on a weekly basis.
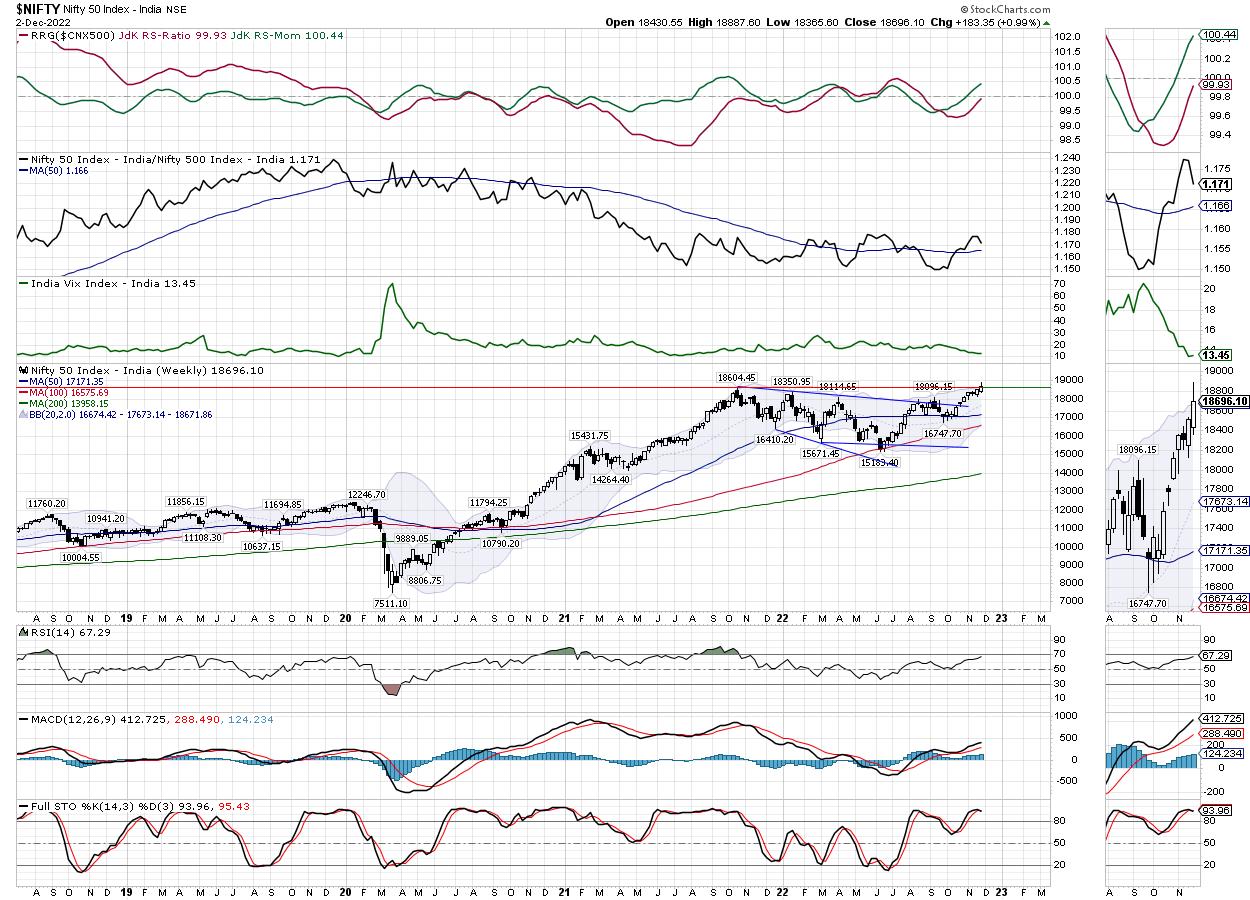
The markets are set to see a stable start to the week. From the technical perspective, the behavior of NIFTY vis-à-vis the levels of 18604 would be extremely crucial to watch. This is the point from where the index tried staging a breakout; it would be crucially important for the index to stay above this point to keep the breakout valid and in force. So long as NIFTY is above this point, it is likely to extend its move towards 18900-19000 levels. Any move below 18600 will delay the breakout and push the markets under some prolonged consolidation. The volatility saw a modest uptick; it rose by 0.88% to 13.45 on a weekly note but remains very near to its lowest levels seen in the year.
The coming week is expected to see levels of 18750 and 18960 levels acting as potential resistance points. The supports will come in at 18580 and 18400 levels. The trading range is likely to stay modestly wider than usual.
The weekly RSI is 67.29; it has marked a new 14-period high which is bullish. RSI does not show any divergence and remains neutral against the price. The weekly MACD is bullish and remains above the signal line.
The pattern analysis of the weekly chart shows that the NIFTY has mildly attempted a breakout by moving past the previous lifetime high point of 18604. The attempt is a mild one because of the retracement that the markets saw from their high point; this breakout could fail if the NIFTY slips below 18600 levels. In other words, staying above 18600 would be crucial for NIFTY if it has to keep the possibilities of extending its move higher open.
The coming week is likely to be a bit of a challenging one; the markets will have to deal with not-so-strong market breadth, NIFTY’s struggle with playing catchup to bank nifty which may result in a lack of confirmation, and VIX staying at one of its lowest levels in this year. It is though recommended to avoid shorting so long as NIFTY is above 18600 levels, the markets must be approached with a high degree of caution. The best method to approach such markets would be to stay highly selective and protect profits at all levels in the markets until the above-mentioned concerns get corrected.
Sector Analysis for the coming week
In our look at Relative Rotation Graphs®, we compared various sectors against CNX500 (NIFTY 500 Index), which represents over 95% of the free float market cap of all the stocks listed.
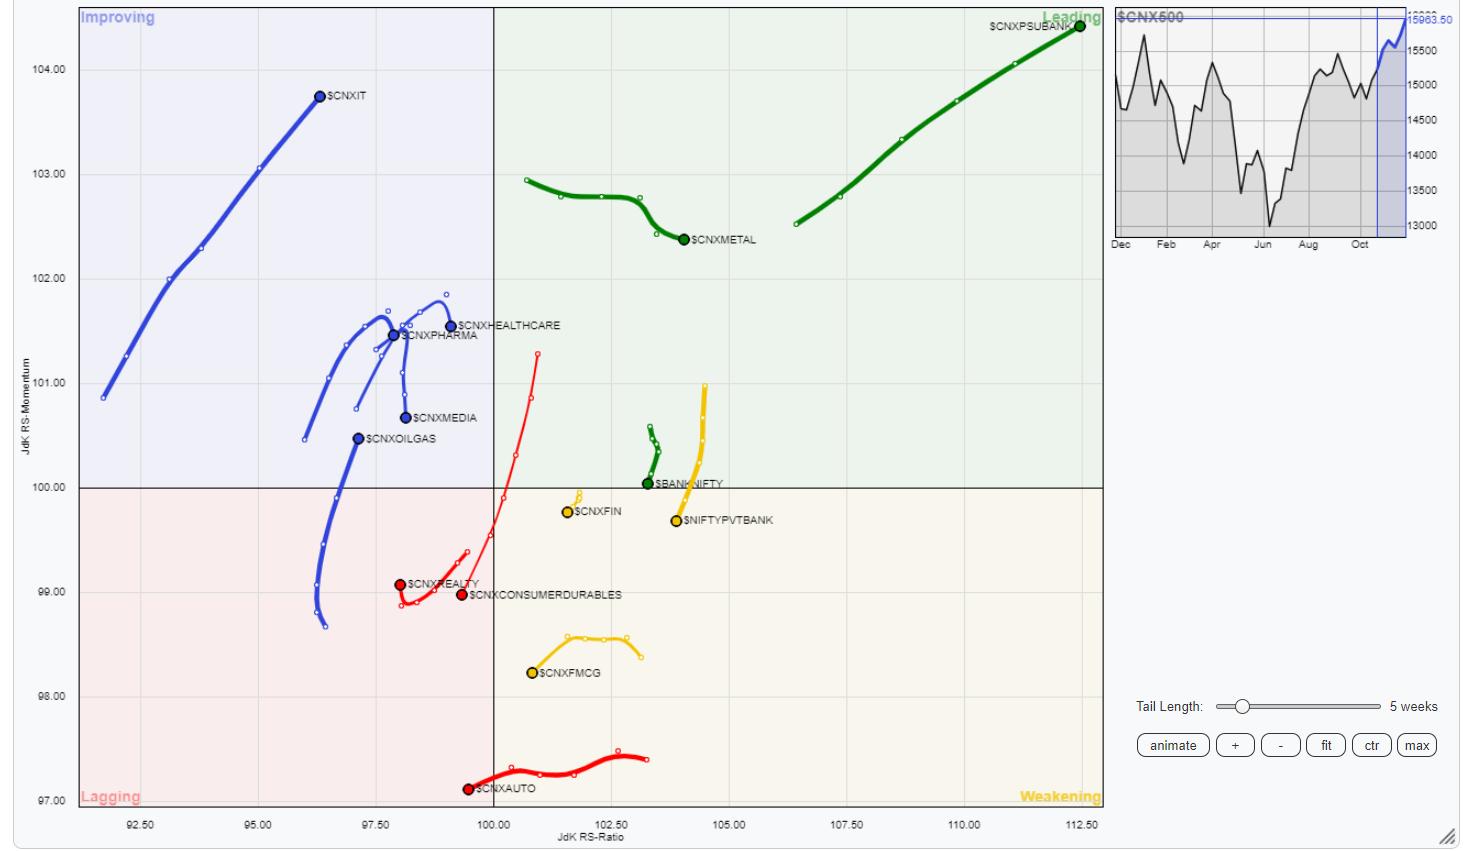
The analysis of Relative Rotation Graphs (RRG) shows no major change in the sectoral setup as compared to what was seen in the previous week. There is a lack of dominant leadership in the markets as very few sectors are in leadership positions. NIFTY PSU Bank Index and Metal Index are the only two sector indexes that are comfortably placed inside the leading quadrant along with Services Sector Index which is hardly seen moving. NIFTY Bank is also inside the leading quadrant but it is seen giving up on its relative momentum against the broader markets.
NIFTY Financial Services, FMCG, Consumption, and Midcap 100 index continue to remain in the weakening quadrant.
The Auto Index has slipped inside the lagging quadrant; it may relatively underperform the broader NIFTY500 index. Besides this, Energy and Realty Indexes are also inside the lagging quadrant but they are seen trying to improve on their relative momentum.
The NIFTY Pharma and Media indexes are inside the improving quadrant; however, they are seen giving up on their relative momentum as well. The IT, Infrastructure, PSE, and Commodities groups are seen advancing nicely while being placed inside the improving quadrant.
Important Note: RRG™ charts show the relative strength and momentum for a group of stocks. In the above Chart, they show relative performance against NIFTY500 Index (Broader Markets) and should not be used directly as buy or sell signals.
Milan Vaishnav, CMT, MSTA
Consulting Technical Analyst