In the previous weekly technical note, it was mentioned about the vulnerability that the market faces due to extremely low levels of VIX. It was expected that such low levels of VIX had left the markets vulnerable to violent profit-taking bouts from higher levels. Precisely on these lines, the Indian equities saw corrective bouts through the week with VIX spiking higher on such occasions. The trading range expanded on the anticipated lines; NIFTY oscillated in a 499-point range over the past five sessions. Despite a decent pullback on the last trading day of the week, the headline index closed with a net loss of 129.05 points (-0.66%) on a weekly basis.
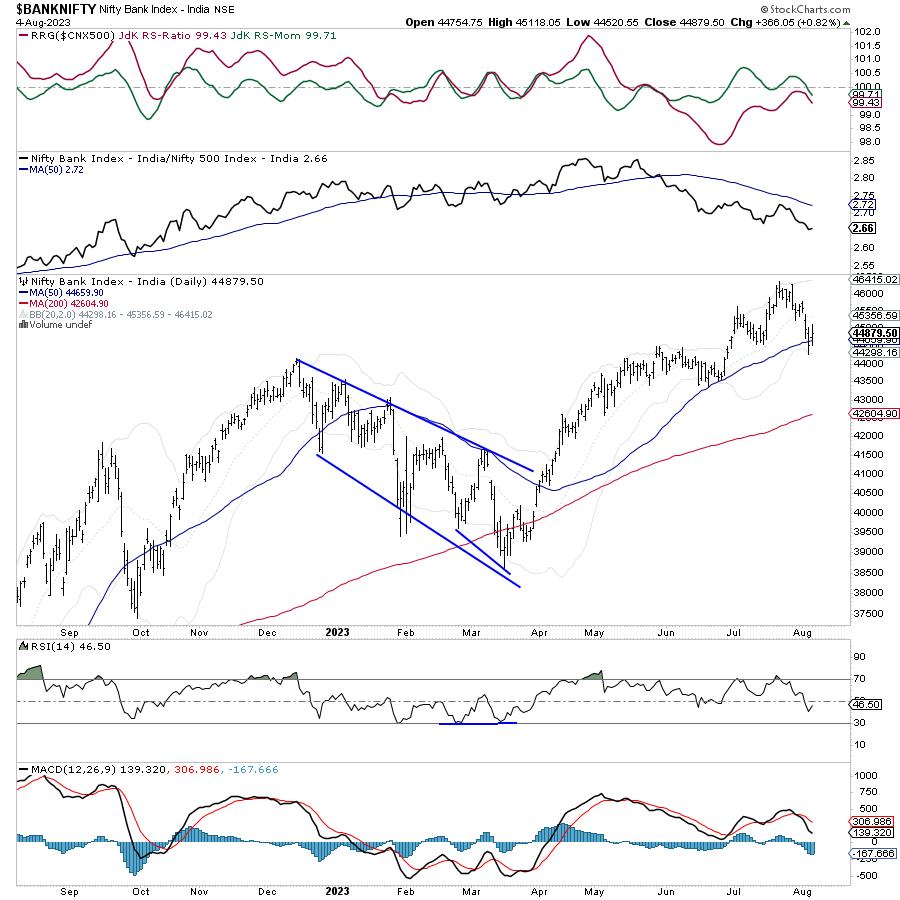
From a technical perspective, the high point of 19991 has now become an intermediate top for the markets. In the process of retracement from higher levels, NIFTY has also dragged its resistance down to 19750 levels. This makes the zone of 19750-19900 a strong resistance area for the markets unless taken out comprehensively. The Options data also suggest a very high accumulation of Call OI between 19800-20000 levels and this makes the zone a formidable resistance for the Index. The VIX, which came off by 5.47% on the last trading day of the week continues to remain at dangerously low levels. Despite the retracement that we saw over the past week, the INDIAVIX has risen by just 4.32% on a weekly note.
The coming week is expected to see the levels of 19620 and 19750 acting as strong resistance points. The supports are likely to come in at 19380 and 19200 levels.
The weekly RSI stands at 67.87; it stays neutral against the price but it has slipped below 70 after staying inside the overbought zone. The weekly MACD is bullish and stays above the signal line. A candle with a long lower shadow occurred; although this needs confirmation on the next bar, it has the potential to keep the markets under consolidation while disrupting the current rally.
The pattern analysis of the weekly charts shows that NIFTY achieved a breakout as it surged past the previous high point of 18887; the breakout saw the Index surging almost 1100 post the breakout. However, it has formed the high at 19991 and this has now become an intermediate top for the markets for the near term unless taken out comprehensively.
All in all, the texture of the markets will continue to stay defensive and highly stock-specific. Also looking at the global technical setup, it should not be surprising to see some risk-off play happening in the markets. It would be wise to cut exposures into high beta and economy-facing names. From the banking space, PSU banks are likely to relatively outperform the private baking names. It would be prudent to stay invested in defensive quarters like IT, Consumption, PSE, etc., while also staying stock-specific while picking stocks. A cautious outlook is advised for the coming week.
Sector Analysis for the coming week
In our look at Relative Rotation Graphs®, we compared various sectors against CNX500 (NIFTY 500 Index), which represents over 95% of the free float market cap of all the stocks listed.
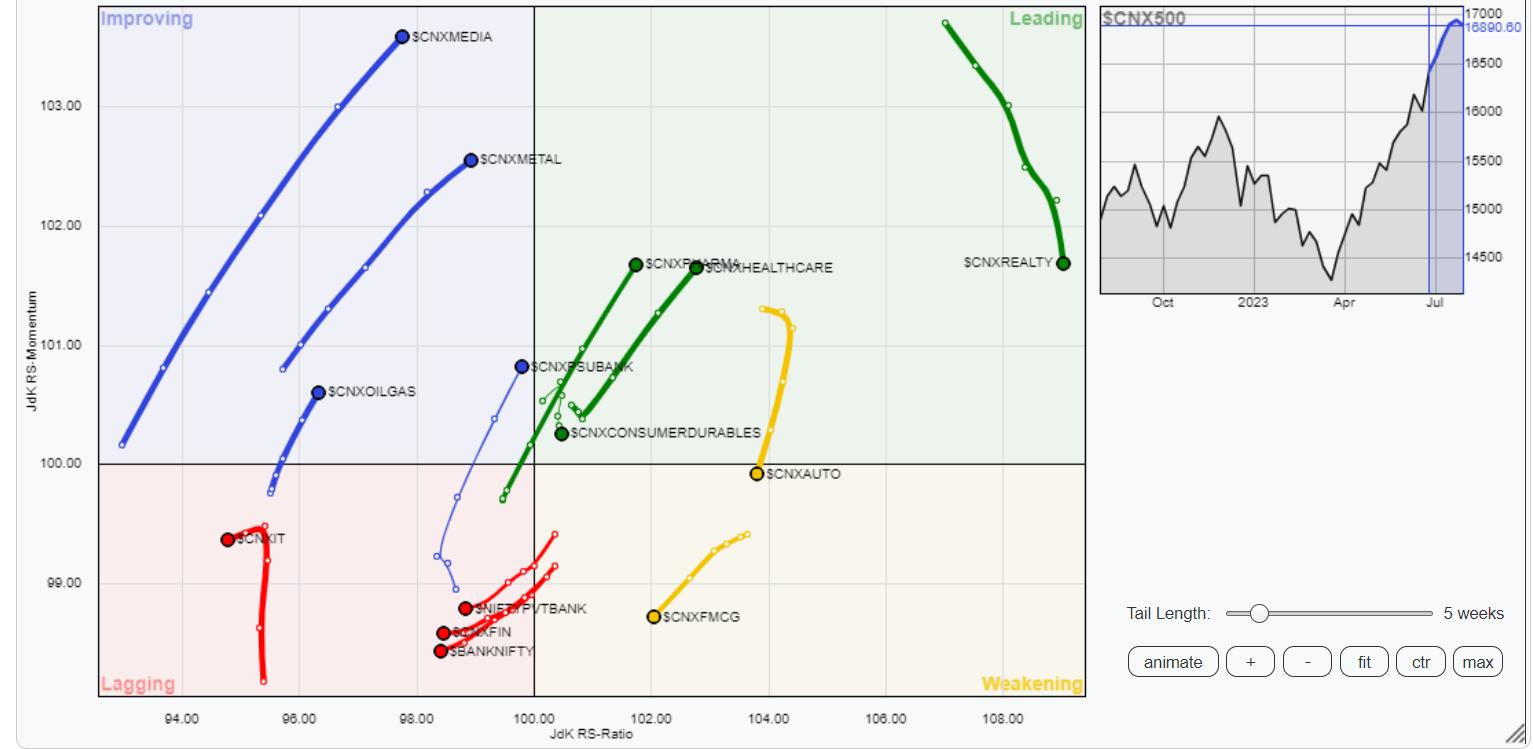
The analysis of Relative Rotation Graphs (RRG) shows an evident lack of leadership as well as a defensive setup as the Pharma Index is the only one that is comfortably placed inside the leading quadrant. The Nifty MidCap 100 index is inside the leading quadrant along with the Realty Index. Out of these two, Realty Index is seen slowing down and paring its relative momentum against the broader markets.
The Nifty Auto and Consumption Indices have rolled inside the weakening quadrant. Besides this, FMCG, PSE, and Infrastructure Indices are inside the weakening quadrant as well. However, among these groups, PSE and Infrastructure Indices are showing improvement in their relative momentum.
Nifty Services Sector, Financial Services sector indices, and Banknifty are seen languishing inside the lagging quadrant. Along with these groups, Commodities and IT groups are also inside the lagging quadrant.
The Energy, Metal, and PSU Bank indices are inside the improving quadrant and are seen rotating firmly in the northeast direction. They may show resilient performance against the broader markets.
Important Note: RRG™ charts show the relative strength and momentum of a group of stocks. In the above Chart, they show relative performance against NIFTY500 Index (Broader Markets) and should not be used directly as buy or sell signals.
Milan Vaishnav, CMT, MSTA
Consulting Technical Analyst