Over the past several days, the global equity markets stayed highly affected by the escalated geopolitical tensions between Russia and Ukraine; with Russia ultimately ending up invading Ukraine. This spooked the global equity markets and India was no exception. On Thursday, NIFTY witnessed one of its worst performances of the recent past; it lost over 800 points on one day only to recover 500 points on the following day. The volatility remained immense given the number of uncertainties that surrounded the happenings around the world. NIFTY had large and wide moves through the week; the Index oscillated over 1147-point and finally ended with a net loss of 617.80 points (-3.58%) on a weekly note.
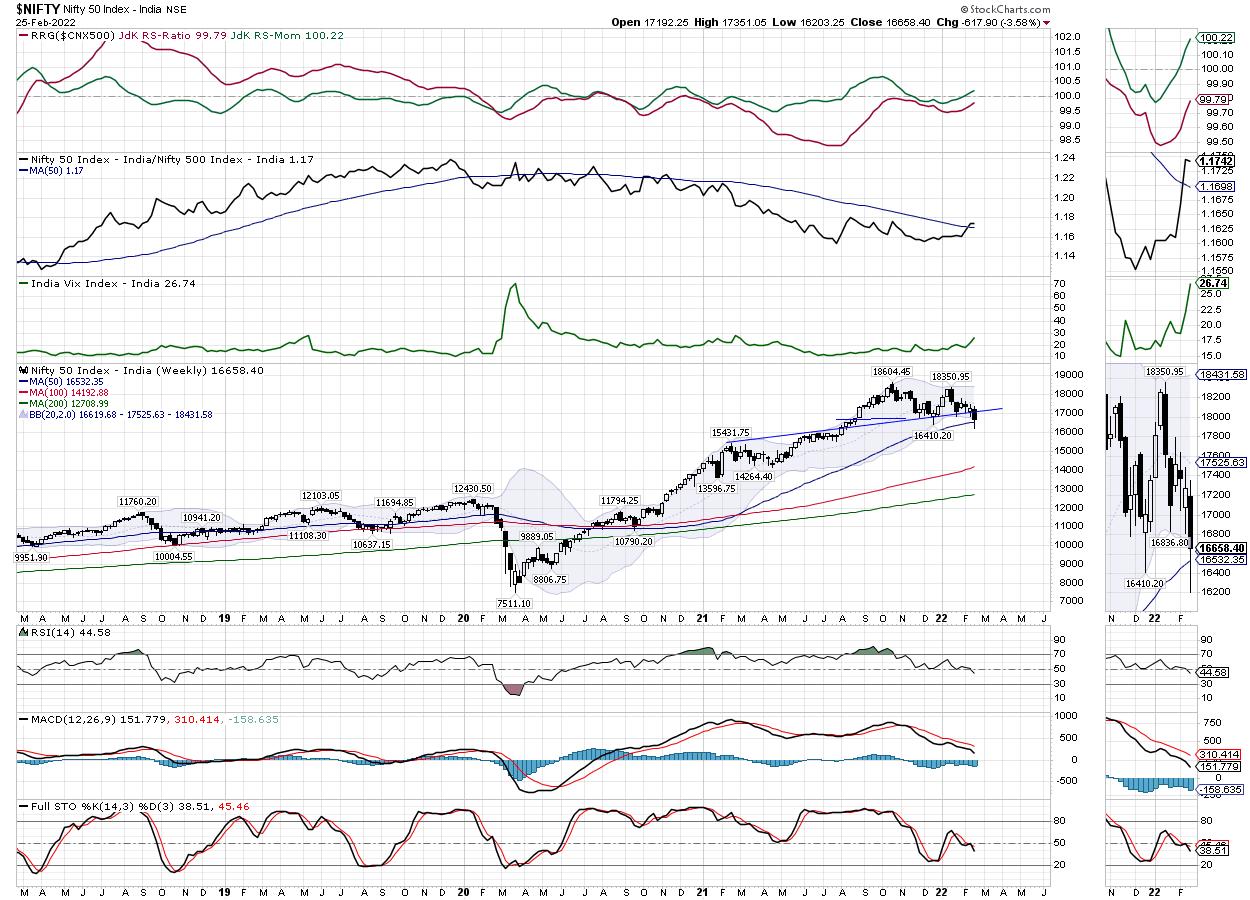
The past few days have been damaging for the markets from a technical perspective. On the daily charts, the NIFTY violated the all-important 200-DMA and has ended well below it. Despite the pullback seen on Friday, the index still remains below this point. On the weekly chart, NIFTY has seen itself violating and slipping below the extended trend line support. This trend line begins from 15431 and further extends to joining the subsequent incremental highs. This level also coincides with the 200-DMA on the daily chart; this means that for any sustainable technical pullback to happen, NIFTY will have to move past the 16800-16850 levels comprehensively.
INDIAVIX, the volatility gauge, spiked during the week. It surged to a 20-month high during the week and ended rising 20.64% to 26.74 on a weekly basis. The coming week is expected to see the levels of 16800 and 16960 on the higher side. The supports come in at 16500 and 16410 levels. The trading range for the coming week will continue to stay wider than usual.
The weekly RSI is 44.56; it has marked a new 14-period low which is bearish. However, it stays neutral and does not show any divergence against the price. The weekly MACD is bearish and stays below the signal line.
The pattern analysis of the weekly charts shows that the index has mildly violated the extended trend line support. For the NIFTY to avoid any structurally confirmed violation of this support, it will have to crawl back above 16850 levels. The longer it remains below this point, the higher will the possibilities of the incremental weakness getting in.
A look at the weekly options data shows high Put writing taking place at 16500 and 16600 levels. On the other side, maximum Call OI has shifted a bit higher to 17000 levels. This means that unless we have a fresh set of negative cues to deal with, NIFTY has got some room for itself on the upside towards 17000. However, for this to happen, moving past the 16800-16850 zone will be crucial. Unless new negatives come up, the bulk of the present geopolitical tension looks factored into the present levels. However, it is recommended that markets may be approached cautiously. It is expected that if the technical pullback continues, some high beta names like Metals, Infrastructure, and Autos may gain. Defensive pockets like IT and Consumption may also put up a relatively good show. A highly cautious and selective approach is advised for the coming week.
Sector Analysis for the coming week
In our look at Relative Rotation Graphs®, we compared various sectors against CNX500 (NIFTY 500 Index), which represents over 95% of the free float market cap of all the stocks listed.
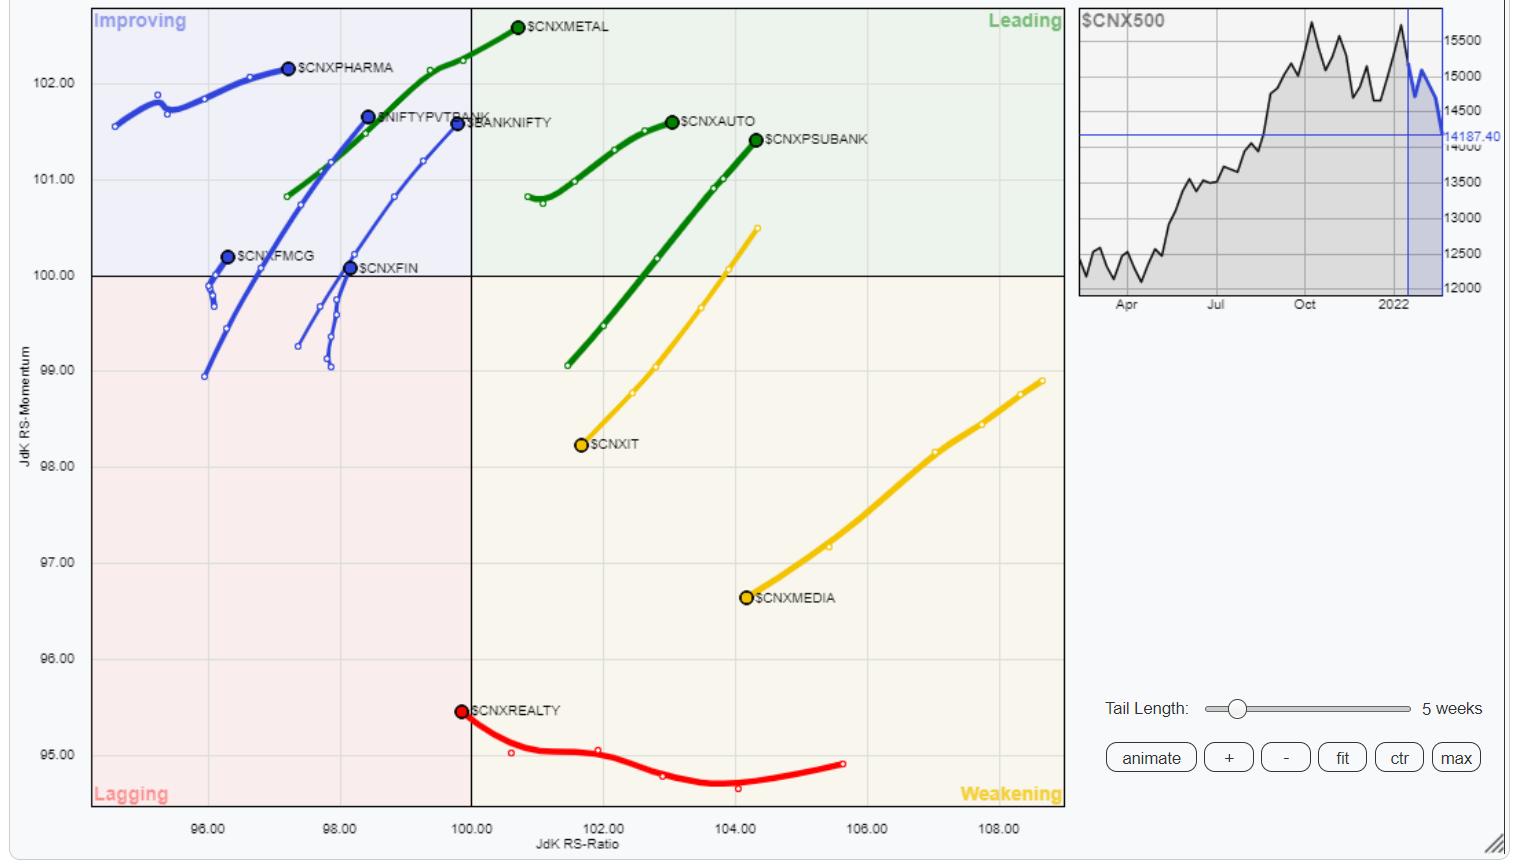
The analysis of Relative Rotation Graphs (RRG) does not show any major change in the sectoral placement. PSUBanks, Commodities, Energy, Auto, and PSE sectors are inside the leading quadrant. They are expected to relatively outperform the markets. The Metal Index has also rolled inside the leading quadrant; this index may also relatively do better than the broader markets.
NIFTY Media, IT, and Infrastructure indices are inside the weak quadrant.
The Realty Index and MidCap 100 index has rolled inside the lagging quadrant. These groups may perform on an individual basis, but on relative terms, they may underperform the broader markets.
NIFTY Financial Services and FMCG indices have rolled inside the improving quadrant. This marks a potential end to the relative underperformance of these sectors. NIFTY Pharma and Banknifty are inside the improving quadrant and appear to be maintaining their relative momentum.
Important Note: RRG™ charts show the relative strength and momentum for a group of stocks. In the above Chart, they show relative performance against NIFTY500 Index (Broader Markets) and should not be used directly as buy or sell signals.
Milan Vaishnav, CMT, MSTA
Consulting Technical Analyst
www.EquityResearch.asia | www.ChartWizard.ae