It’s options-expiration week so literally anything goes, especially with the Volatility Index ($VIX) remaining so elevated. In the very near-term, I wouldn’t be surprised by a quick upside move to channel resistance or even to test the early February high. There’s a TON of net in-the-money put premium in play as we speed towards Friday (options expiration) that would begin to disappear on a rally. The downside is much more open as I believe that’s the path of least resistance eventually. The S&P 500 has neckline support at 4300 that needs to be monitored. Loss of that support would really be problematic for the bulls as fewer and fewer large cap stocks are healthy enough to stabilize the index. I could most definitely see a swift decline to 3800, which is nothing more than the measurement of the current head & shoulders topping pattern in place.
Here’s the short-term channel that I’m watching on the S&P 500:
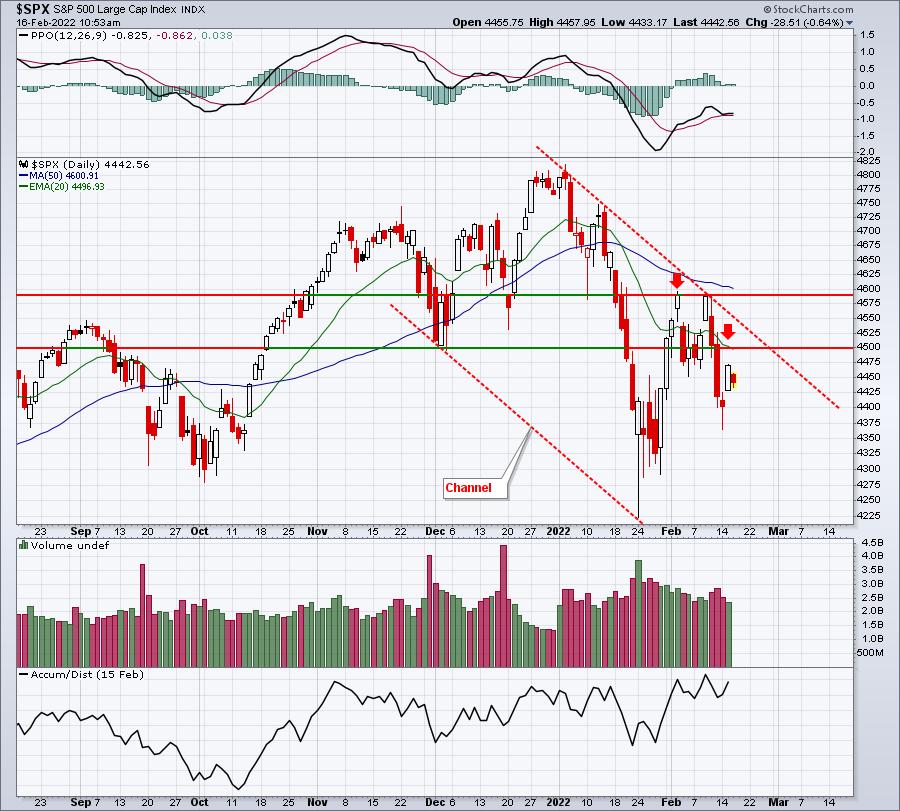
The recent price highs are just beneath 4600 and the 50-day SMA is exactly at 4600. Should the channel be broken to the upside, there’s that price resistance and the 50-day SMA converging near 4600. If the S&P 500 can clear all of that congestion, then a re-evaluation would be in order. Until then, my bias is clearly bearish in the near-term, options-expiration Friday withstanding.
Large-cap growth ($DJUSGL), which has such a heavy presence in and influence on the S&P 500, is the sub-group to watch. I believe its chart pattern is even more bearish than the S&P 500 itself. Check out the daily and weekly charts of the DJUSGL:
Daily:
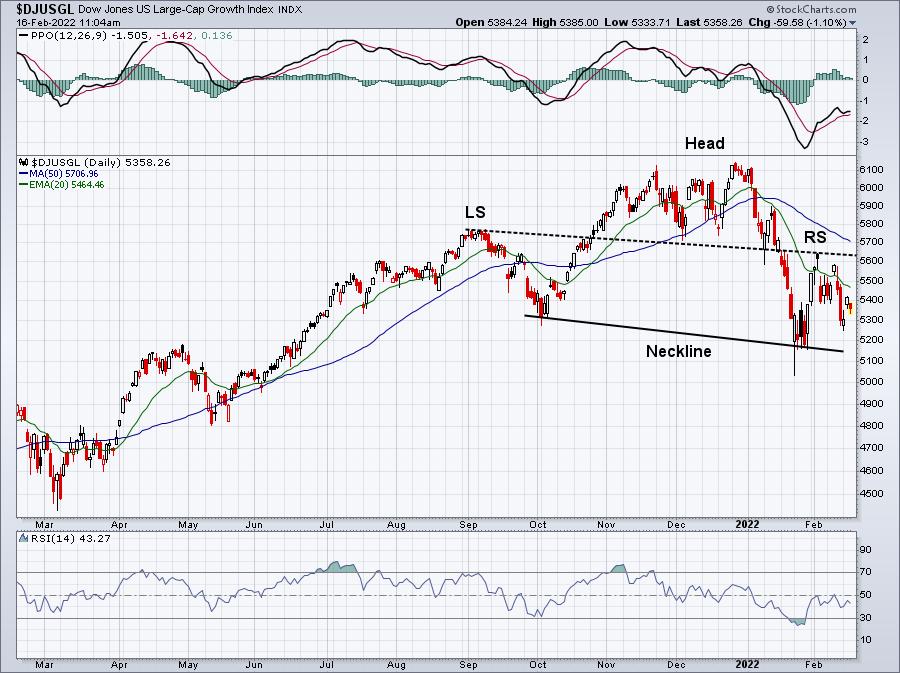
The daily RSI moved below 30 for the first time in the past 52 weeks. Typically, RSI support is closer to 40 during an uptrend. Note also that the bounce in the RSI only made it back to 50 thus far. RSIs that hit lows in the 20s and fail to break 60 on highs represent readings during cyclical bear markets. The down-sloping shoulders and neckline also are much more bearish than more symmetrical head & shoulders patterns – in my view. But it doesn’t stop there. We’re seeing weakness on the weekly charts like we haven’t seen in many months:
Weekly:
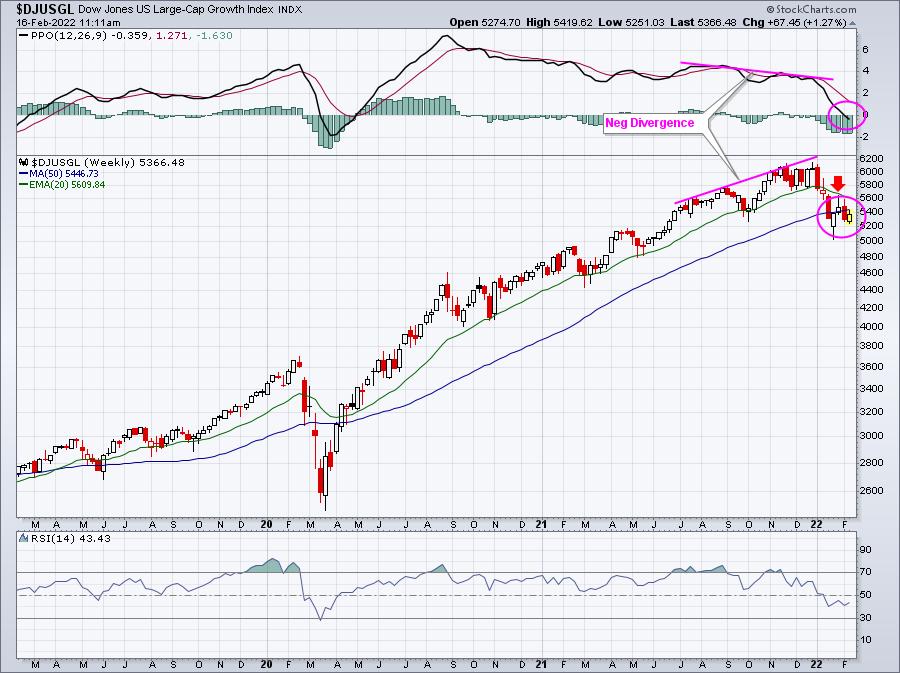
Slowing momentum was definitely an issue at year end and I always look to “resets” of the PPO when a negative divergence prints. This reset, however, has already crossed the PPO centerline in bearish fashion. Also, once the 20-week EMA support was broken, it has served as resistance (red arrow). Price action that trends beneath its 20-day EMA provides a very bearish slant as well. The black arrow shows a previous top (resistance) that once broken, provides support on pullbacks. We’ve now tested that level. While I believe the odds are less than 50/50, there’s certainly still the chance that this 5150-5200 support level holds. That is what the bulls NEED to keep this short-term correction from turning into a much deeper cyclical bear market.
Whether we break down or not, I remain VERY BULLISH the longer-term. I believe we’ll get signals over the next 1-3 months of a MAJOR bottom. If I’m correct, the opportunity in growth stocks over the balance of 2022 and into 2023 will be tremendous – similar to 2020.
Today, at 4:30pm ET, I’ll be hosting our FREE quarterly “Sneak Preview – Top 10 Stocks” event. I’ll discuss our current quarter and since-inception results, along with the philosophy that has led to tremendous outperformance. While the current environment has been challenging for growth stocks, I believe inflation will peak fairly soon. When it does, history suggests you want to have exposure to this fast-growing area of the market. We’ll be ready.
Below is a link to the room. The event will get started promptly at 4:30pm ET and the room will be open by 4:00pm ET.
https://earningsbeats.zoom.us/j/86882675636
Attendance at all of our free events requires a FREE EB Digest newsletter subscription. If you join the event today, we’ll make sure to get you set up with an EB Digest subscription. There is no credit card required and you may unsubscribe at any time.
Happy trading!
Tom