Created many years ago, Volatility Time Bands came out of the need to be more dynamic in the computation of Risk and Expectations when building short-term systems. It was clear from the beginning that depending on when a trade was entered dictated what could be realistically expected. Designed for Futures and Spot Fx, if a trade was placed at 2 a.m. risk and expectation was far removed from a trade being placed at 2 p.m.
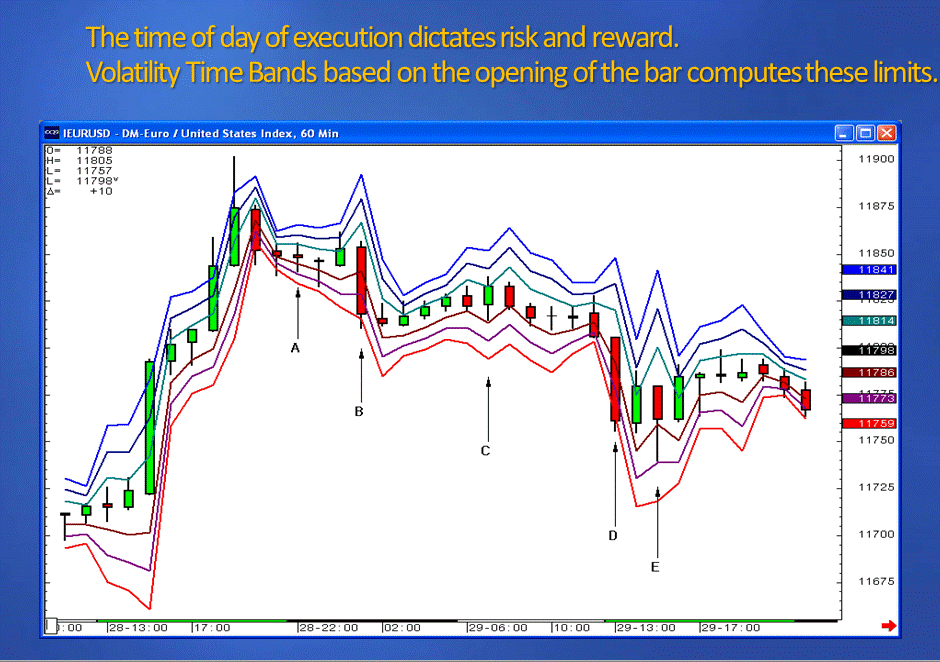
Volatility Time Bands compute Risk and Expectation by looking at the time of day and then, based on when the Bar opens, placing 1, 2 and 3 Symmetrical Standard Deviations around the 22-period average of range. The reason for 22 is that it is roughly equivalent to 1 month. The chart below shows how this applies to Spot Eurodollar. A equals Australia’s opening, B Tokyo’s, C London and D and E the times when American economic statistics come out. The Bands reflect the changing dynamics and therefore allow for different risk, expectation and volume. The values being created on the Opening mean that Limit orders can be placed, with a multitude of other applications possible, such as multiple timeframe limits of range for the time of day.
In truth, in its most basic interpretation, this study does not lend itself to individual stocks. The reasons are many, including the condensed nature of the trading day, the fact that stock-sensitive news comes out when the stock is closed and many economic statistics do likewise. However, they do have extremely useful applications for Index Futures, and can be used in combination with Range Deviation Pivots in order to connect the Time of Day extreme to the Trend Skewed limits to create zones of support and resistance. When taken at this more advanced aspect in looking at Multiple Timeframe Confirmation, the true power of this study is revealed and can be applied to stocks. All aspects of the Bands applications are covered in depth in Chapter 1 of Trading Time.
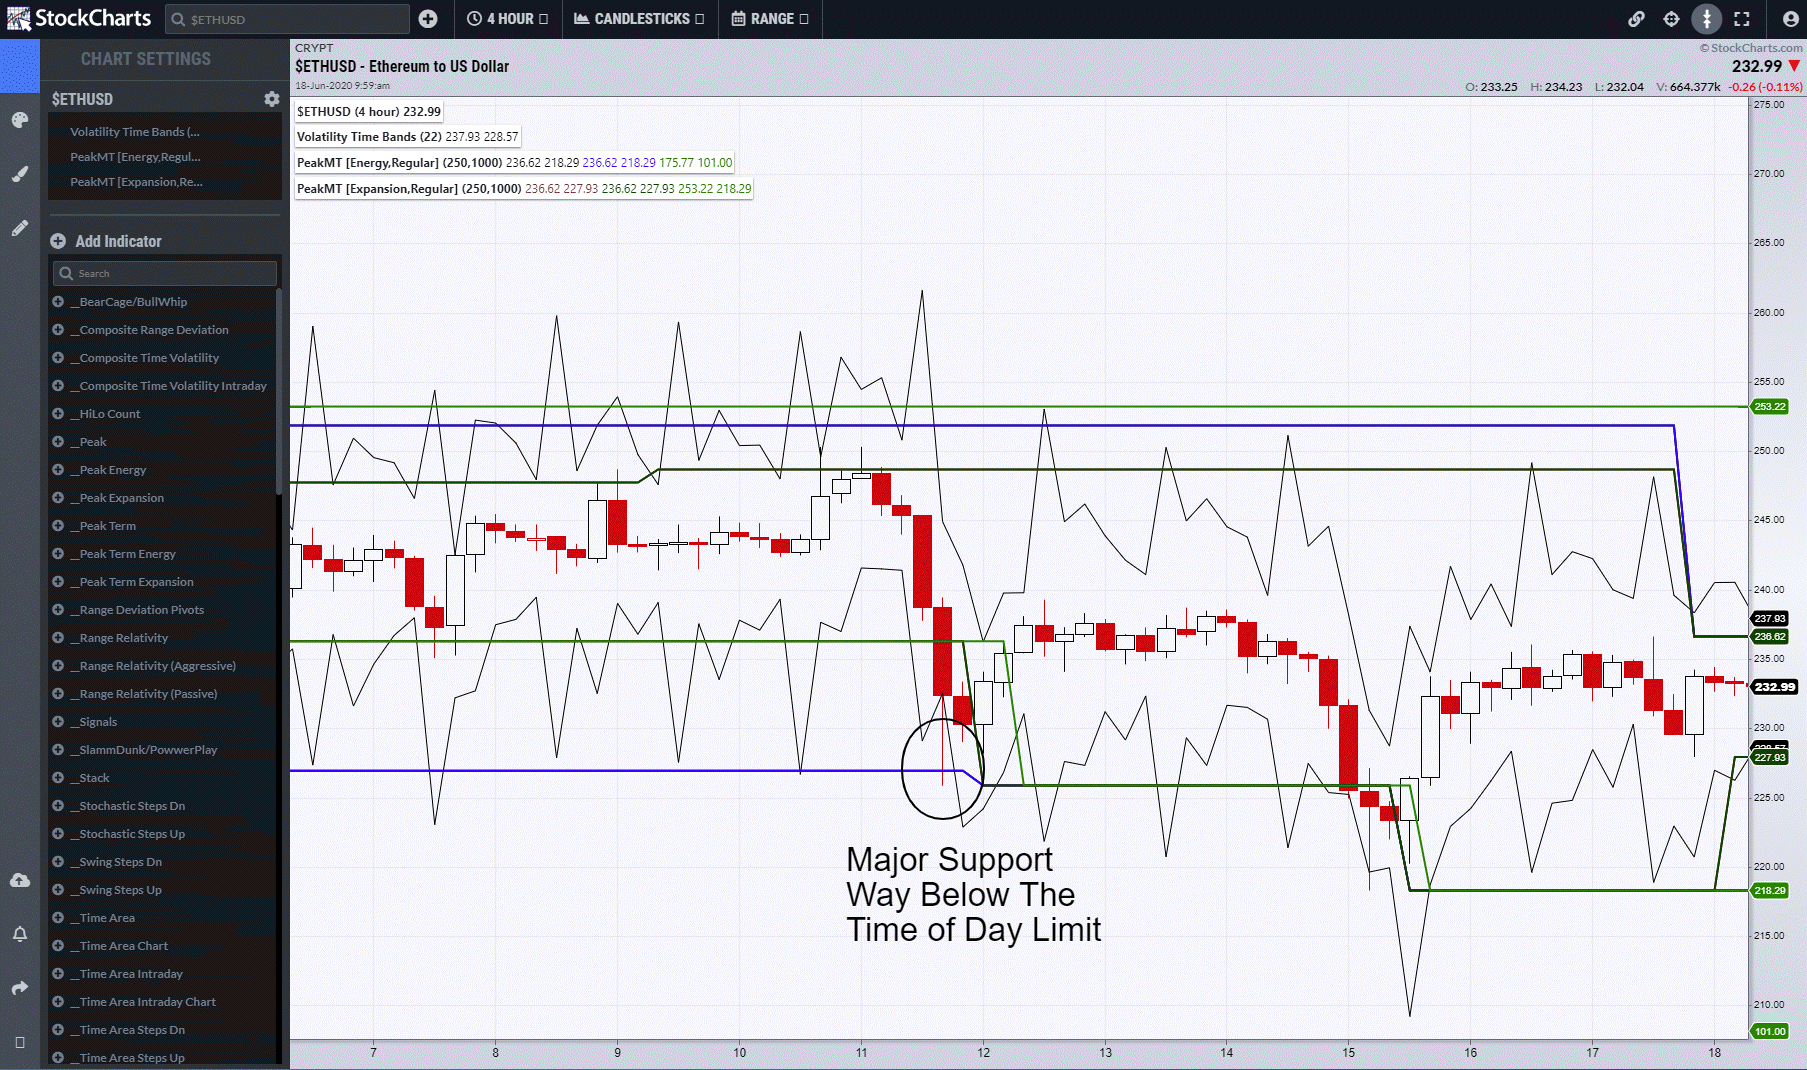
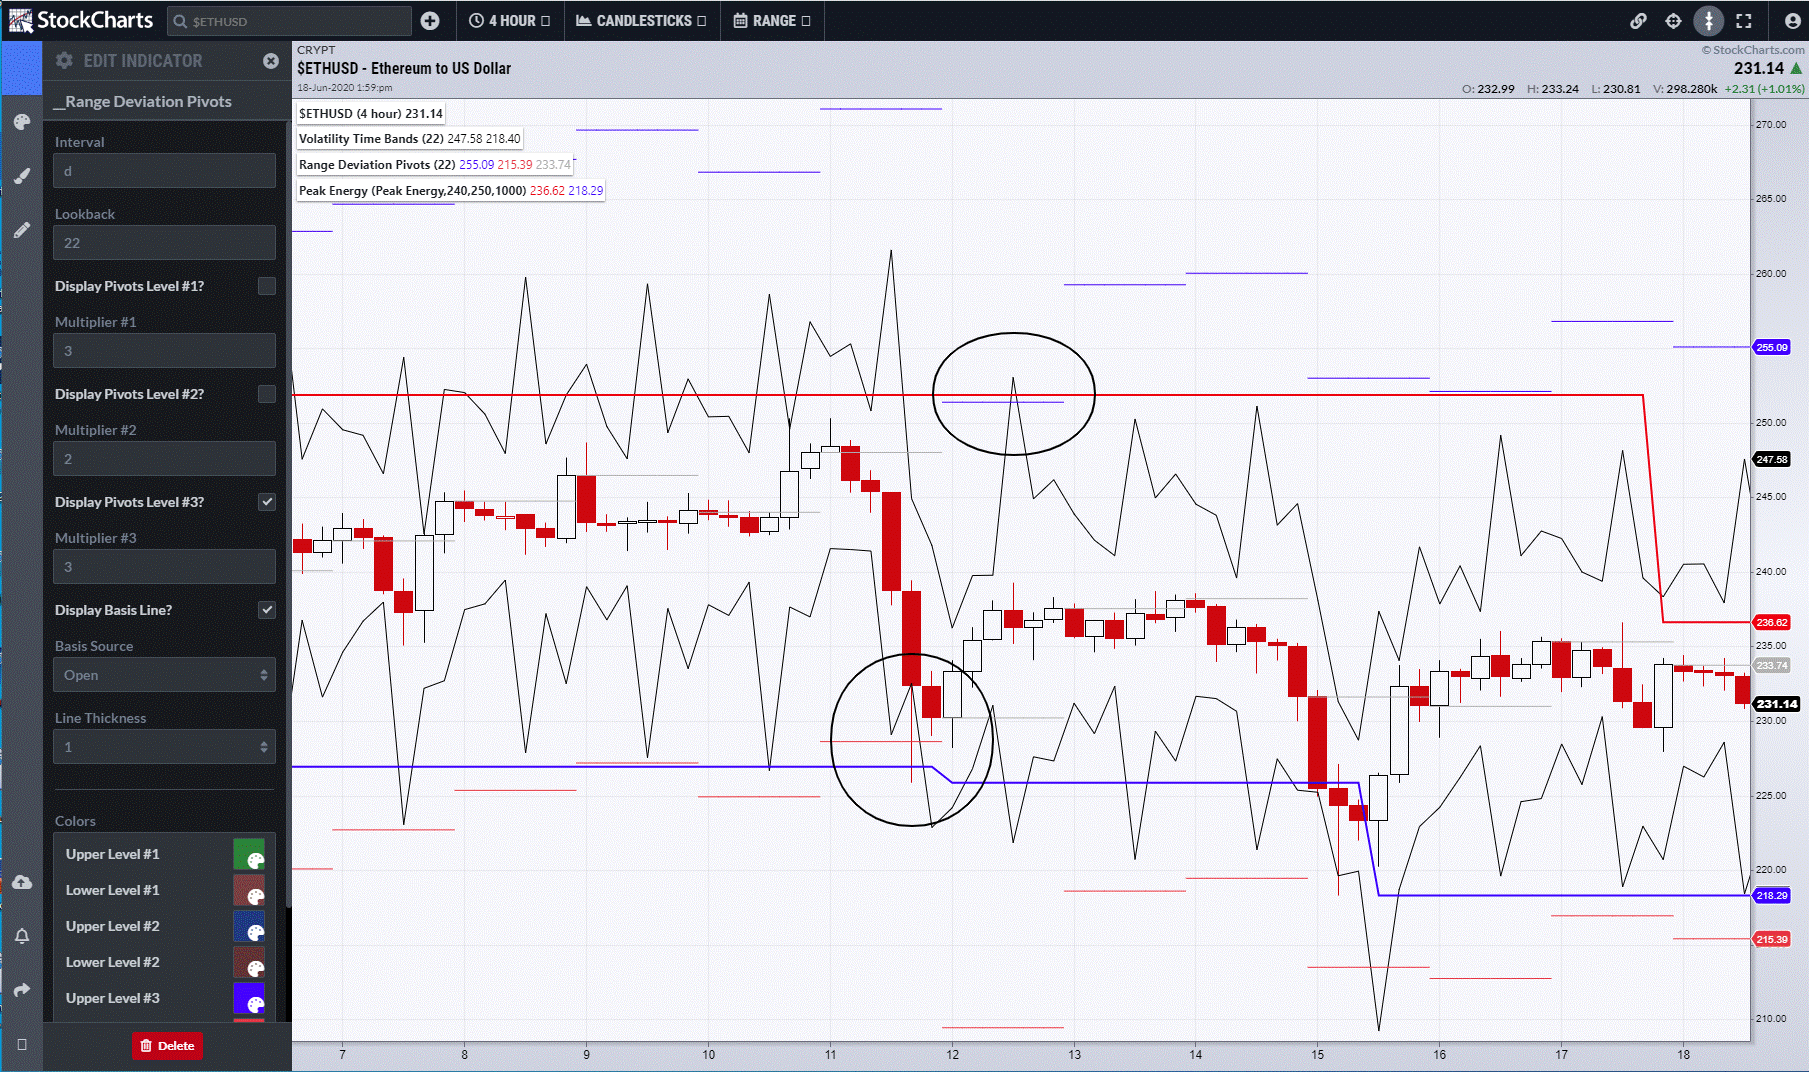
One area of application is the Bands’ relationship to Peak Energy and Expansion. Taking Cryptocurrency as an example, the chart below is a 4-hour Etherium ($ETHUSD). Final Blue Line Peak Energy support is already known and, on the opening of the Candle, the Limit of Range at the 3rd Deviation Time Band Down is known as well. It is way above the support, meaning that a limit order can be placed at that support safe in the knowledge that, for the time of day, it is a very powerful level. By the end of the period, price closed at the 3rd Deviation Band having bounced significantly.
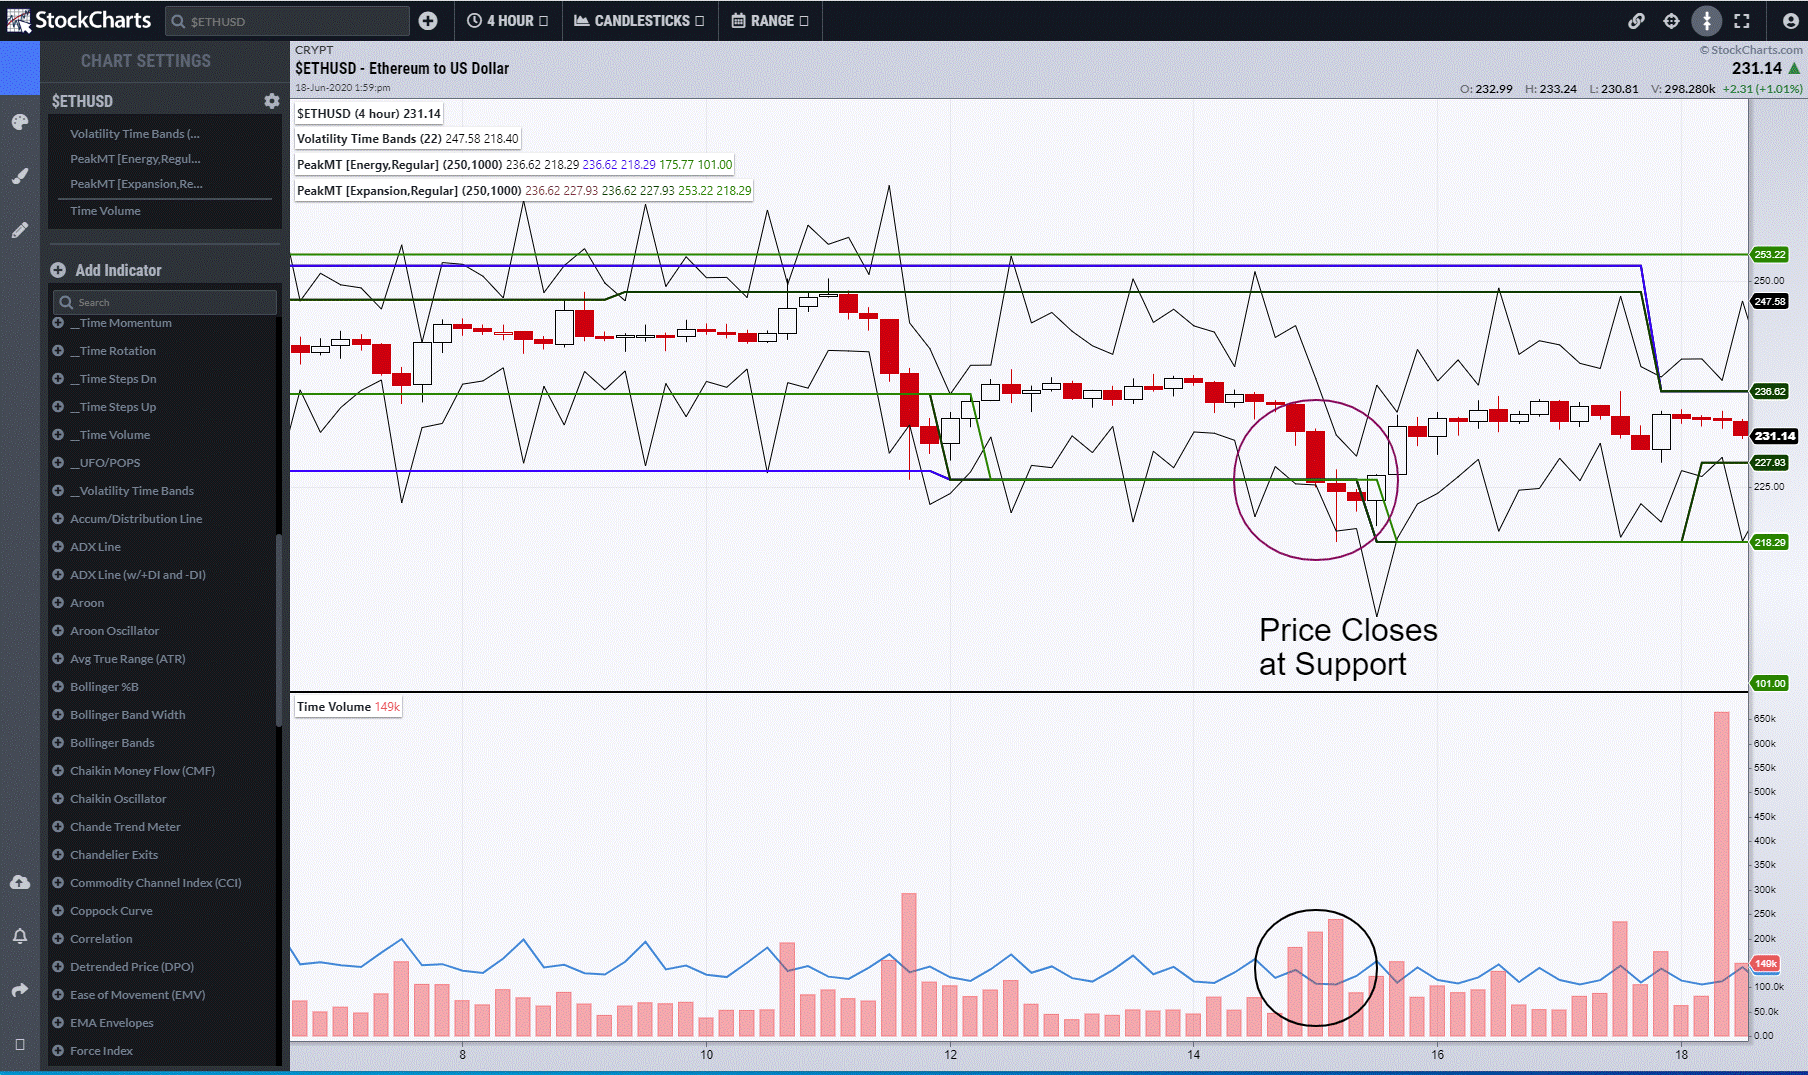
Move forward a few days and the price action highlights the importance of how far into the completion of the Candle dictates whether a trade is valid. Price returned to the support point, but this time it was close to when the Candle was completing. This is not a valid entry point because the new Candle will open soon and redefine risk once more. Subsequent to that, price forms a low at the 3rd Deviation and can be connected with another study. Time Volume takes the same concept as the Bands, but computes the current volume against the 22-day average of volume for that time of day. It shows that the Hammer Doji that was created at the lows and hit the limit of Range for the time of day, while also having significantly higher volume for the time of day as well.
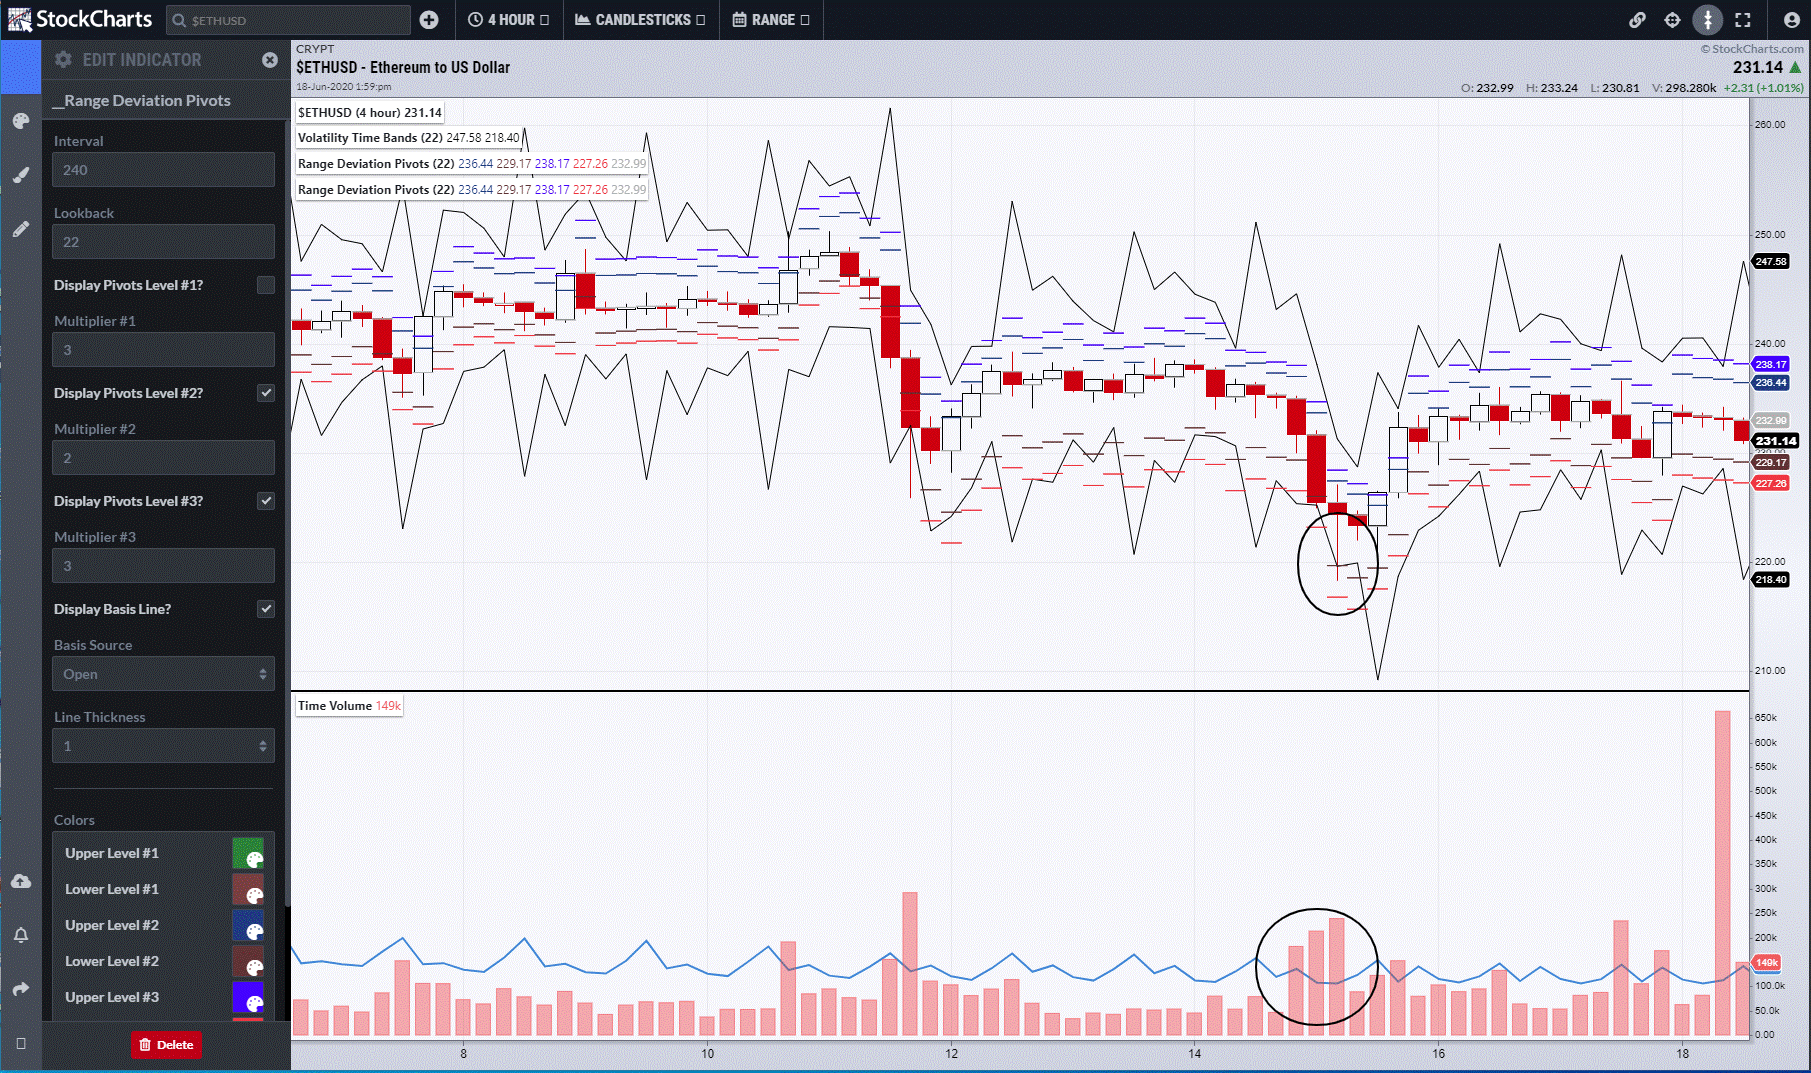
The application of Volatility Time Bands can also be used with Range Deviation Pivots for the same timeframe or for connecting with the Historical values to either gauge the strength of the Level or compute Stop Loss points. Taking the same point, the Time Band 3rd deviation was at exactly the same point as the 2nd Range Deviation, thus increasing its strength. The latter study’s in-built skew with the trend allowed more space for the limit of that trend to be quantified. Therefore, if price closes below the 3rd Range Deviation Point, the trend is accelerating and the Stop Loss activated.
Next we’ll return to the first signal, which now has the Daily Range Deviation Pivots placed on top and the Peak Energy Point support. We can see the Daily Limit of Range on the Pivots (horizontal red line) is also above the support point. This multiple-timeframe connection is extremely powerful in identifying low-risk short-term entry points. The difference this makes between placing Limit orders at extremes (because the values are fixed and allow for proactive behaviour) and waiting for the close of the Candle cannot be overemphasised. Risk is lowered and so, critically, volume can increase. The next day, the three connected once more (second circle) as the Time of Day, Range Deviation Daily Extreme and Energy resistance produced a condensed and powerful zone of resistance that was never approached.
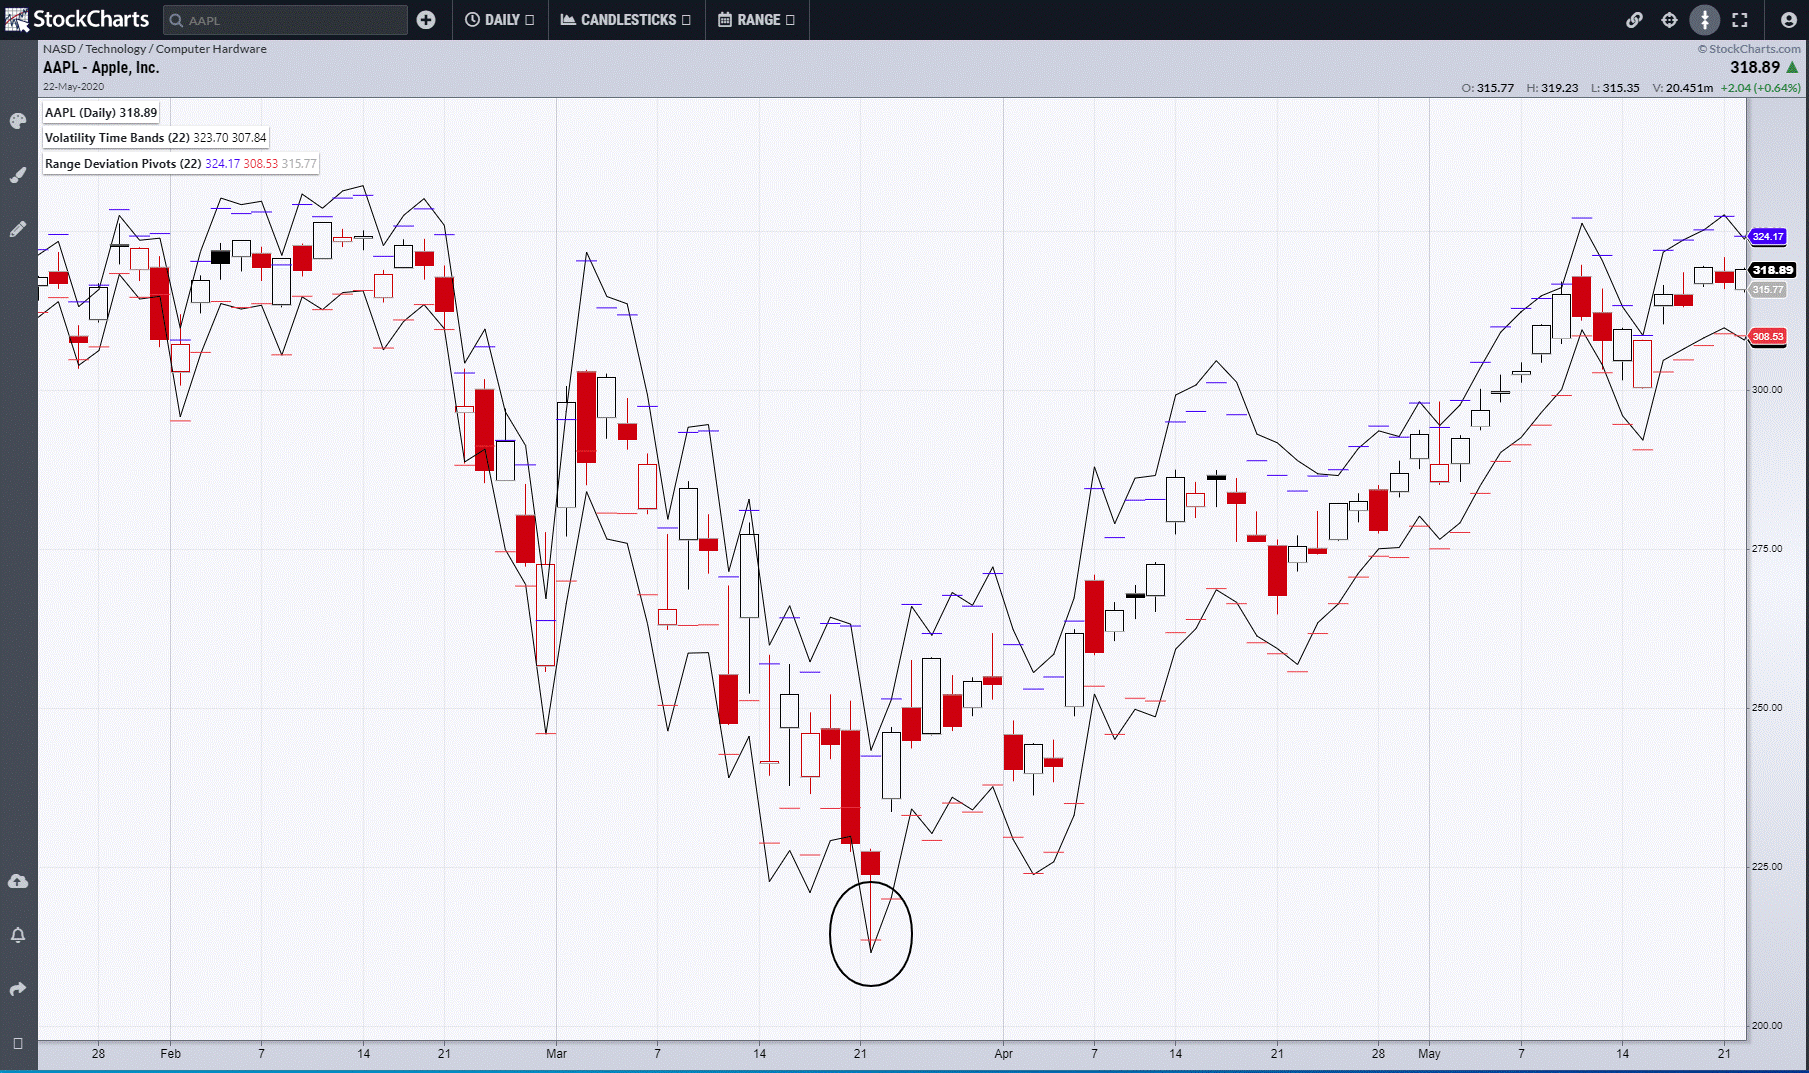
It is this connection, with Historical Limits and Time of day limits, that have the most use on individual stocks. The chart below is of Apple (AAPL) on the day of the low for the year. Volatility Time Bands on Historical data have no time element, but still can be used to create a zone of extremes when combined with the Range Deviation Pivots as circled.
Armed with this knowledge, as soon as the stock opens, it is possible to connect this back to the time of day. The two-hour chart shows the Time Band limit is 212.33, whilst 4-hour is at 212.90. It is possible to zoom right down and the 60-min reveals a limit of 212.31. The low of the day and year was 212.04. The following Candle shows price closing above the 3rd Band and volume being lower than average. This is also critical information, as periods of low volume in relationship to range are equally revealing as high volume. Price has exhausted itself and required little volume in order to move beyond its upward limit for the time of day.
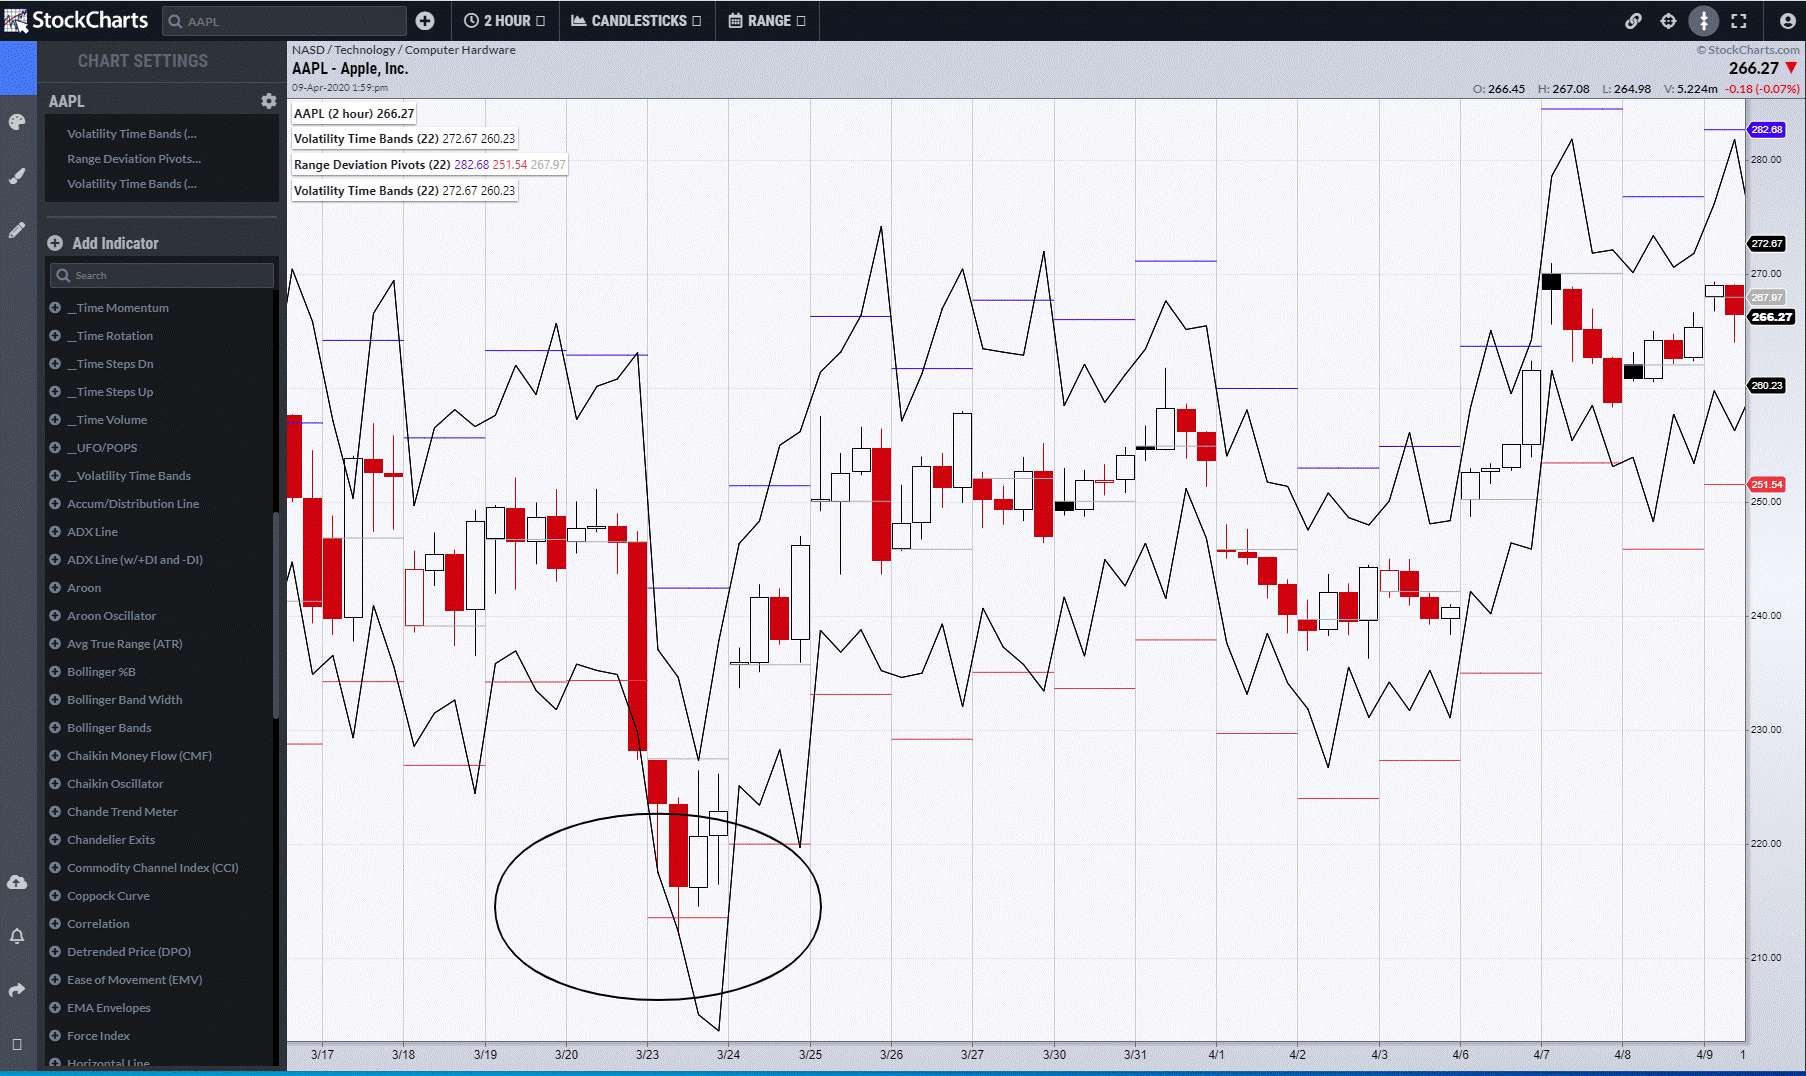 Apple, 2-hour
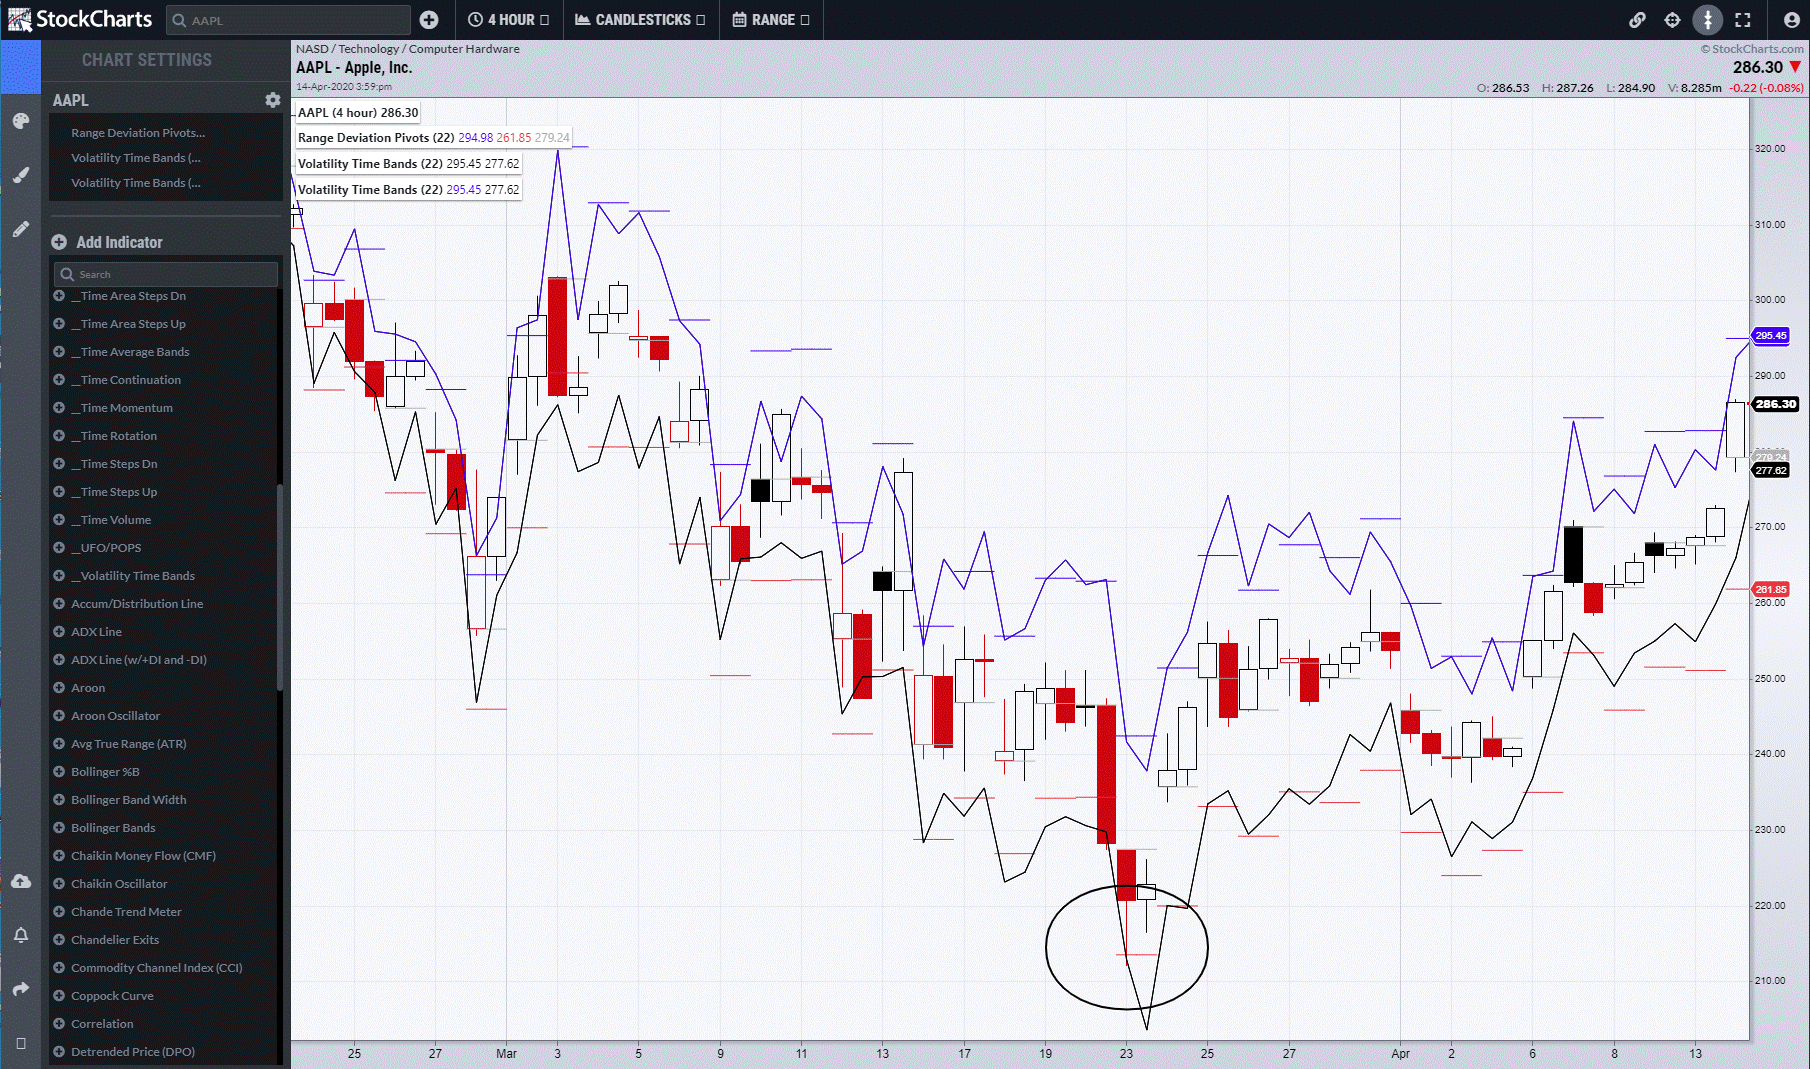 Apple, 4-hour
Here is the 1-hour chart for AAPL. An hour after the low, price closes above the 3rd Time Band Up.
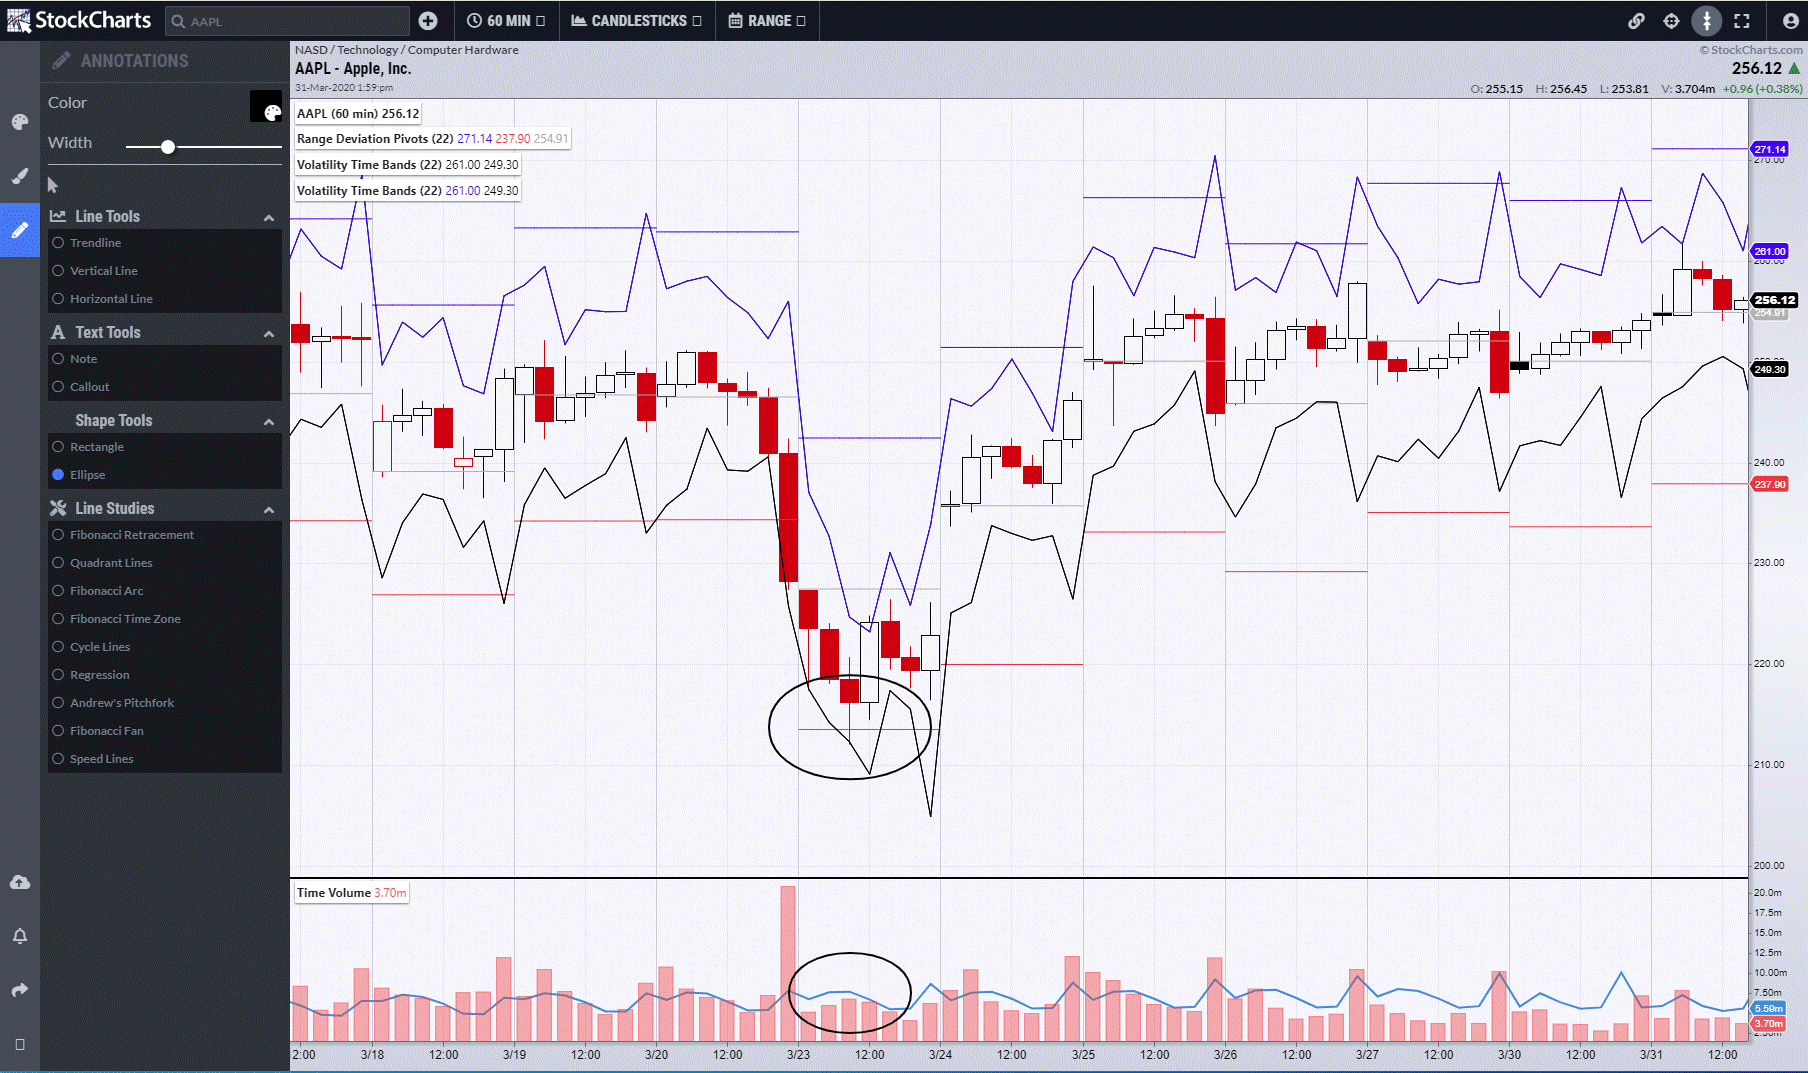 Apple, 1 hour
By the close of the following day, price advanced 17% from the low risk, high volume entry point. The trade from humble beginnings in a low timeframe is now referencing daily data. This means that the recent, seemingly aggressive breakout buy from the Stochastic Steps blog is actually a far less risky Pyramid trade to an existing position. These opportunities are rare, so it is essential that your trading world of stocks of choice is defined and, when the market opens, Price Alerts are created near to where the historical limit is, so that, if activated, there is time to go through your analysis and execute your decisions.
I can be contacted at shaun.downey@aol.com to answer any questions.
Shaun Downey