There’s been one common denominator thus far in earnings season. High-flying stocks have seemed to hit a brick wall after posting earnings – even spectacular, way-above-consensus-estimates earnings. That was my biggest question as we headed into earnings season. I knew the numbers would be incredible across several different industry groups and the leaders within those groups. Wall Street has clearly been forecasting that through their accumulation of such groups and stocks. It honestly gets back to that old Wall Street adage, “buy on rumor, sell on news”. Tesla (TSLA) reported off-the-chart type results. It also saw an initial spike as it gapped higher $86 on Thursday morning. From there, however, it was all downhill:
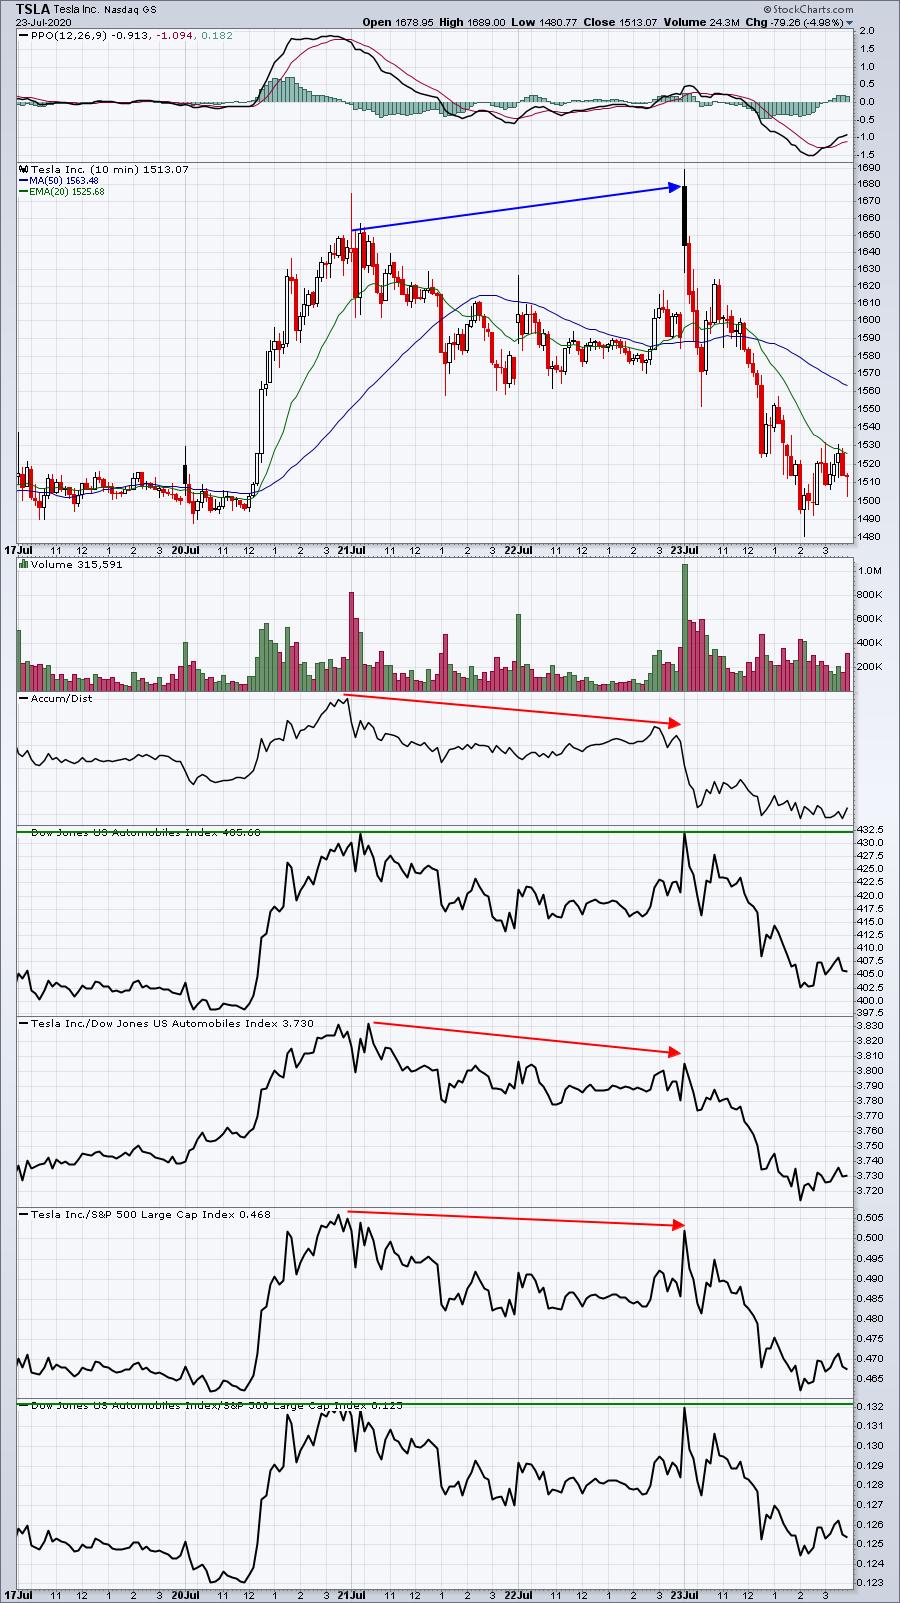
This chart reeks of distribution to me. Both Tuesday and Thursday saw selling nearly all day and Thursday’s volume was very heavy to boot. It certainly appears to me that market makers are now on the short side. So I’ll be looking for consolidation over the next few weeks. Make no mistake, I’m VERY bullish TSLA longer-term, but as a short-term trader I look for key tops and bottoms to know when to trade on the long side and when to sit out. I believe holding overnight will be the big problem in the near-term. That’s where we could see the most significant deterioration in price. Intraday, there could be opportunities on the long side, but I’d personally be nervous holding overnight – at least for now. The gap downs will scare the retail trader, while institutions will use that weakness to accumulate. The daily chart shows the accumulation/distribution line rising throughout 2020:
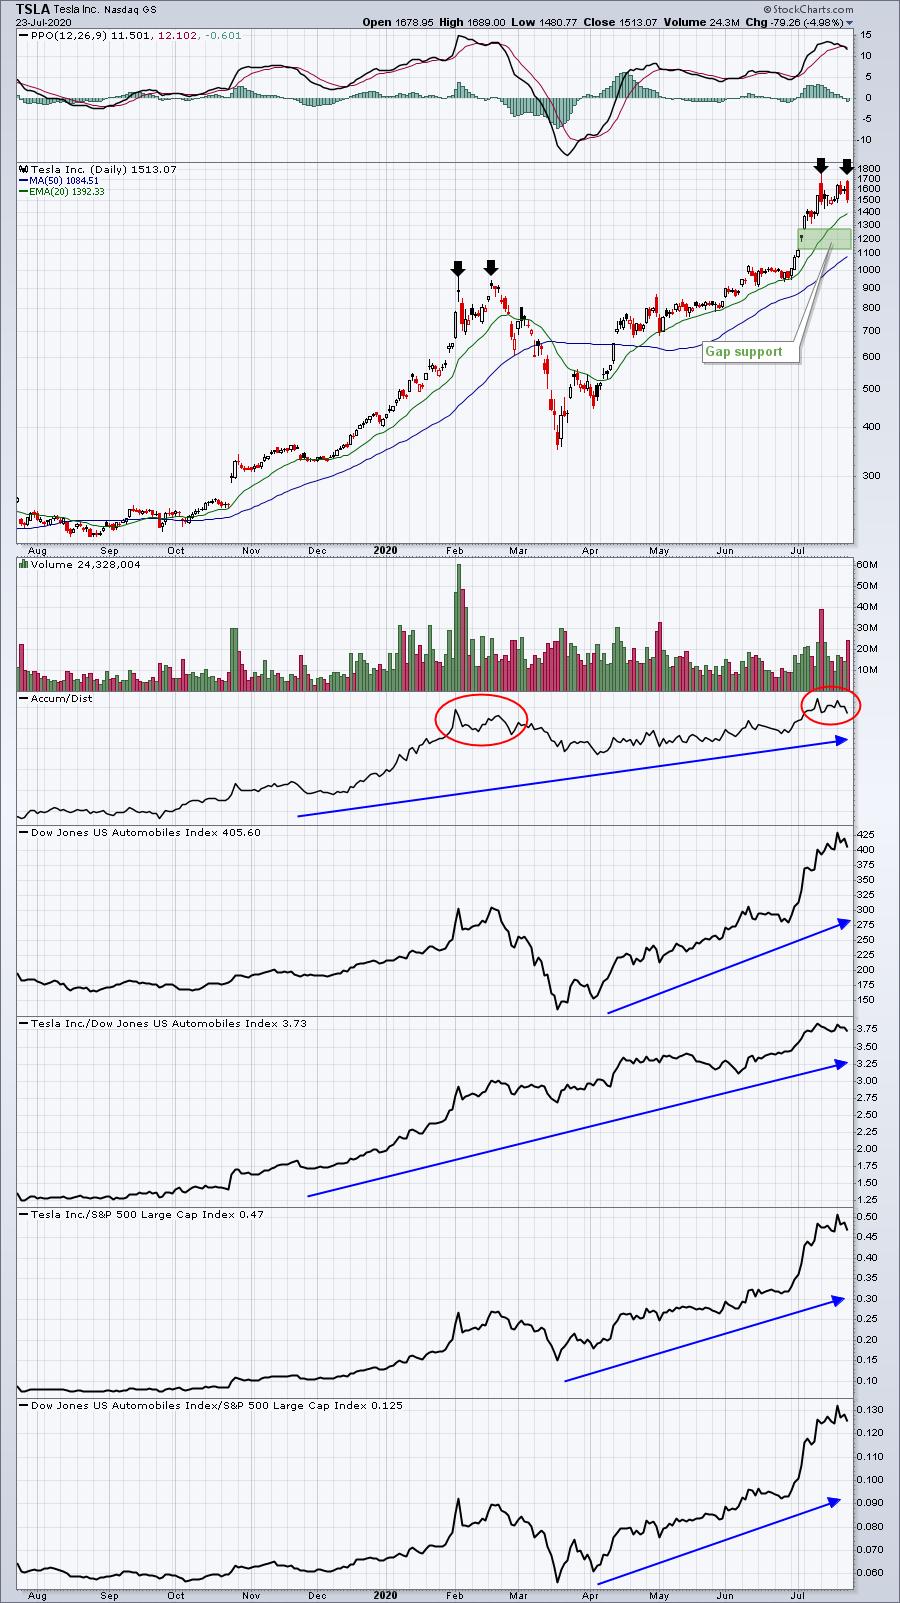
I absolutely love this chart. The AD line, along with all the relative strength panels, moving higher from left to right. TSLA is a leader in autos ($DJUSAU) and autos have been the best industry group in 2020. However, stocks consolidate. TSLA is due for a period of selling/consolidation and I believe the latest signals are pointing to the start of it. I’d look for at least a temporary bounce off the 20 day EMA, with possibly even another run at the high. But ultimately, a move lower into the gap support zone identified would make sense to me.
TSLA could be ready to idle.
I’ll be posting many thought-provoking, earnings-related charts in our free 3x per week newsletter, EB Digest. If you’d like to subscribe, it’s simple! Enter your name and email address HERE and join our growing EarningsBeats.com community!
Happy trading!
Tom Bowley, Chief Market Strategist
EarningsBeats.com