 Last week I wrote about the downtrend in SPY and showed a resistance/reversal zone based on broken supports and the 50% retracement line. SPY failed at this zone and moved sharply lower this past week. This is hardly surprising because the Market Regime is bearish and bearish outcomes are more likely in such an environment.
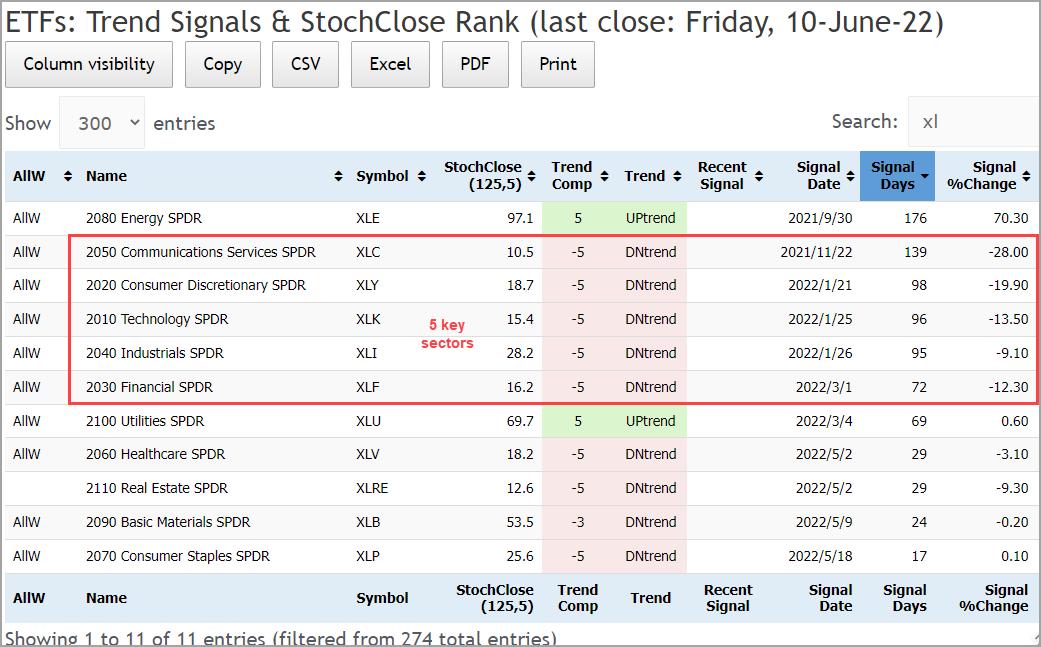
This bearish environment is also reflected in the Trend Composite signals for the big sectors. The Technology SPDR (XLK), Consumer Discretionary SPDR (XLY), Communication Services SPDR (XLC), Industrials SPDR (XLI) and Finance SPDR (XLF) represent key areas of the stock market (economy) and account for some 65% of the S&P 500. The Healthcare SPDR (XLV) is more defensive in nature and accounts for 14% of the S&P 500.
The table below shows that the Trend Composite has been bearish for three big sectors since January (XLK, XLC, XLI) and one big sector since November (XLC). XLF joined the bearish parade on March 1st. Thus, the five offensive sectors accounting for 65% of the market have been in downtrends since March 1st. You cannot have a bull market when these are trending lower.
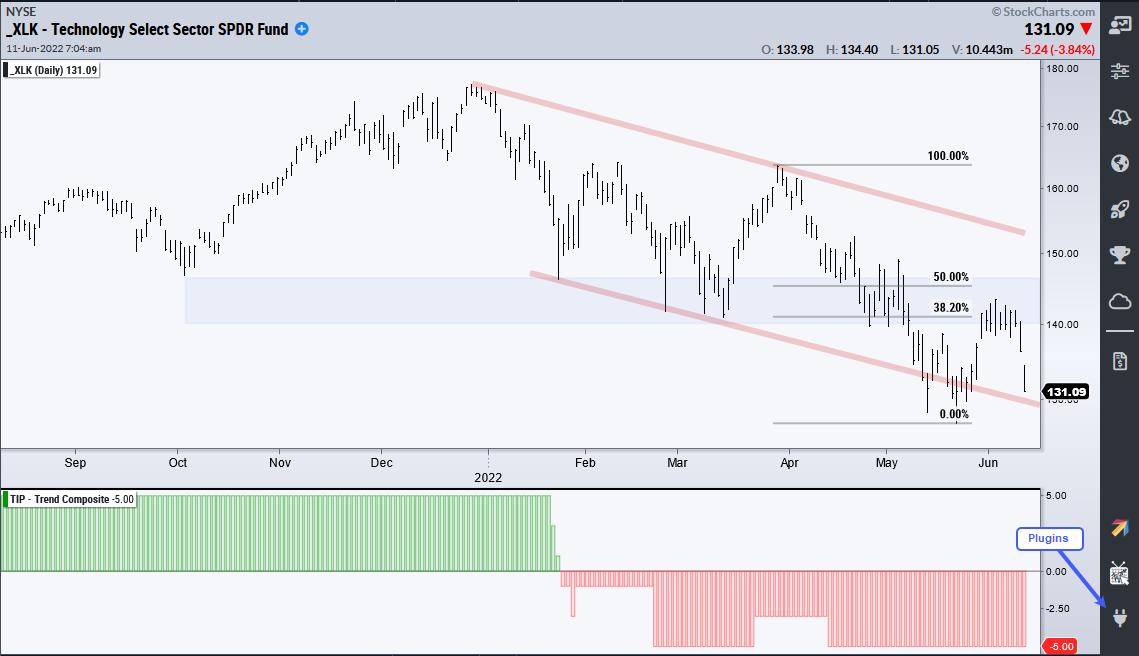
The next chart shows the biggest sector in the S&P 500 (XLK 27%) in a clear downtrend and hitting resistance near broken support. The ETF also reversed in the 38-50% retracement zone. This means there were two steps down from early April to mid May and less than one step up from late May to early June. Two steps down and one step up equals a downtrend. The bottom window shows the Trend Composite turning negative in late January and staying negative. We cannot expect the S&P 500 to move higher when its biggest sector is moving lower.
This week at TrendInvestorPro, we showed in the Market Regime update that BBB and CCC yield spreads remain elevated and this shows stress in the credit markets. The current focus is on energy, agriculture and some metals related ETFs because they are leading our trend signal and ranking table. Click here for immediate access.
In this week’s Next Level Charting video (here), I showed the resistance-reversal zone in SPY and the charts for the big sector SPDRs. These are important for setting our trading bias (bullish/bearish) and staying on the right side of the trend.
The Trend Composite, Momentum Composite, ATR Trailing Stop and eight other indicators are part of the TIP Indicator Edge Plugin for StockCharts ACP. Click here to take your analysis process to the next level.
—————————————