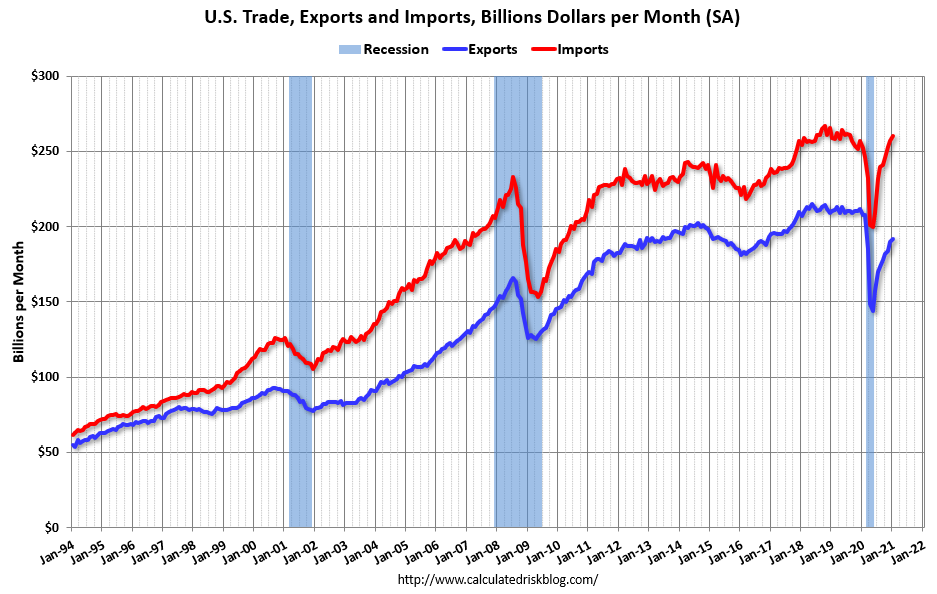
The U.S. Census Bureau and the U.S. Bureau of Economic Analysis announced today that the goods and services deficit was $68.2 billion in January, up $1.2 billion from $67.0 billion in December, revised.
January exports were $191.9 billion, $1.8 billion more than December exports. January imports were $260.2 billion, $3.1 billion more than December imports.
emphasis added
 Click on graph for larger image.
Both exports and imports increased in January.
Exports are down 7.6% compared to January 2020; imports are up 3.2% compared to January 2020.
The second graph shows the U.S. trade deficit, with and without petroleum.
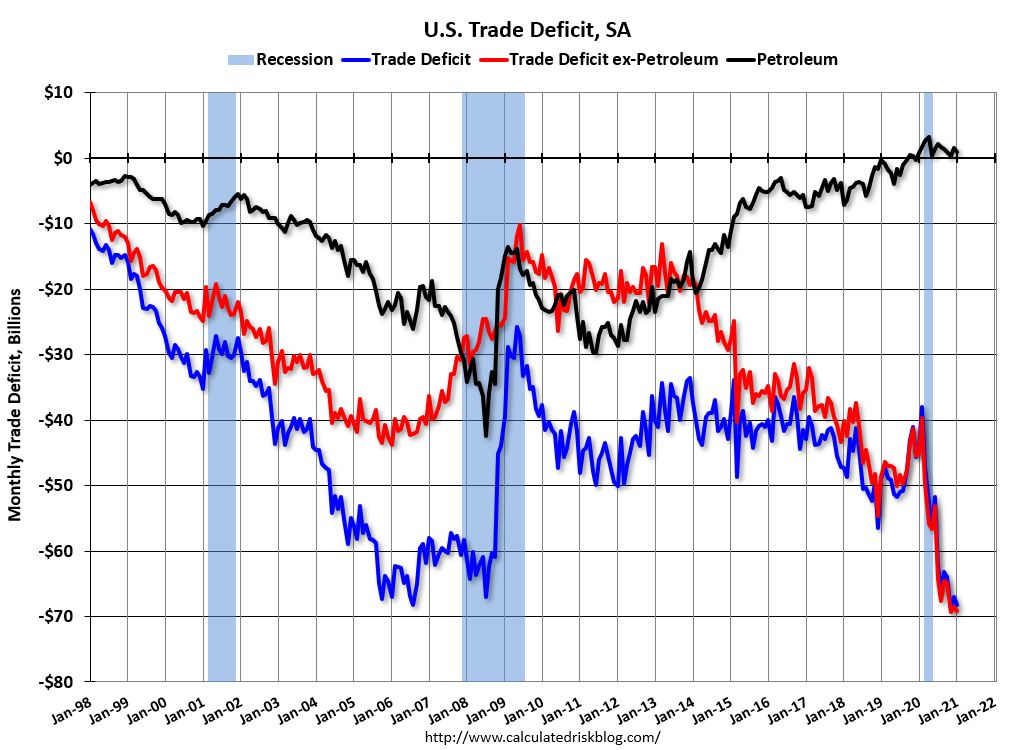 The blue line is the total deficit, and the black line is the petroleum deficit, and the red line is the trade deficit ex-petroleum products.
Note that the U.S. exported a slight net positive petroleum products in recent months.
Oil imports averaged $42.50 per barrel in January, up from $38.30 per barrel in December, and down from $52.24 in January 2020.
The trade deficit with China increased to $26.3 billion in January, from $26.1 billion in January 2020.