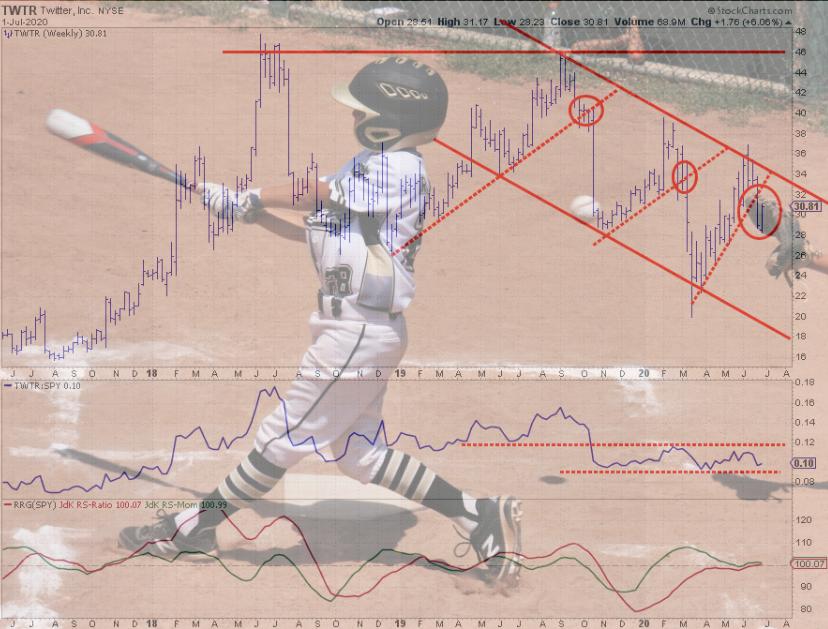
On the weekly chart of Twitter a clear downward trend is visible. The last three peaks are lining up nicely and connecting a downward sloping resistance line. Parallel to that downward sloping resistance line there is an also downward sloping support line that connects the last three lower lows.
This channel on the weekly chart is now in play since September 2019. What caught my eye studying this chart is the regular rhythm of gradual rises followed by sharp drops.
The first rise starts late 2018 and leads to the mid-2019 peak, then a sharp drop breaks the uptrend that was in play. The drop ended at a low in October 2019.
Out of that low a new gradually rising (counter)trend emerged, leading to a lower high in February 2020 even before Corona started to hit the markets. When the market really started to come down, TWTR again broke the rising support line and rapidly dropped to a new lower low in March.
Together with the market in general, TWTR rallied out of that low but was not able to get back above the highest levels that we saw at the start of the year. As a matter of fact a new lower high was put in place around $ 37.
This third high enabled the drawing of the falling resistance line, which has now become a reliable resistance level, with a matching support line marking the lower boundary of the channel.
The daily chart below, shows the recent move in more detail.
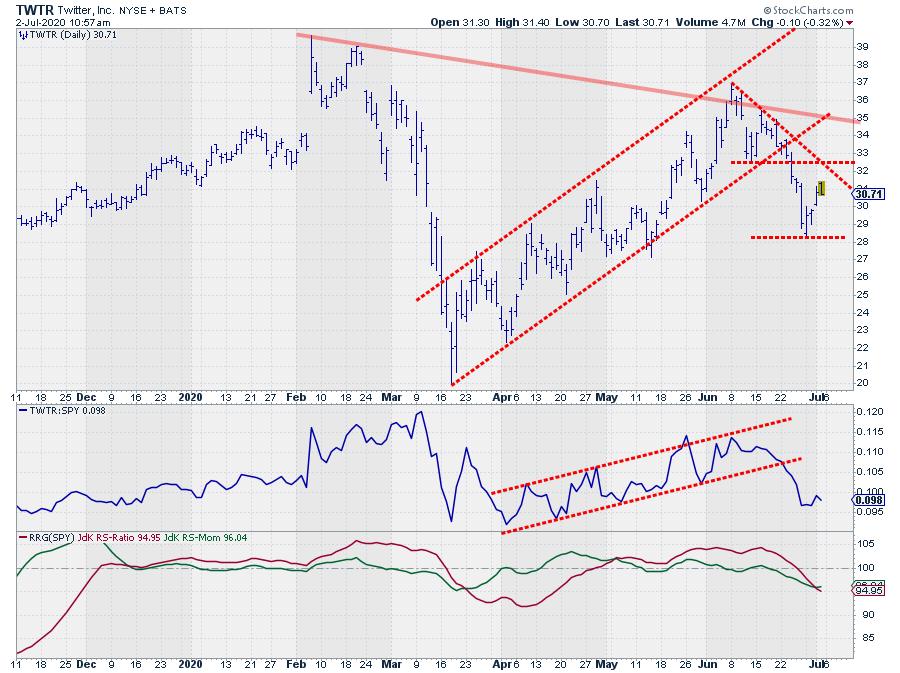
The rally out of the March low traced out a very regular sequence of higher highs and higher lows. Then on June 16 TWTR failed to take out its previous (daily) high, followed by a downward break of the rising support line on 23/24 June. This break led to an acceleration of the decline which for now ended at a new low just above $26.
IMHO the current up-move is a recovery in a falling trend. On this daily chart there is double resistance around $32 which, I think, will be hard to break. A break below the recent low will very likely trigger another acceleration lower.
All of this is confirmed by weakness in the relative strength line which has also left its rising trend, causing the RRG-Lines to both push below 100, pushing TWTR into the lagging quadrant on the RRG.
For the time being upside potential for TWTR seems limited while there is plenty of downside risk.
#StaySafe, –Julius
Disclaimer: This blog is for educational purposes only and should not be construed as financial advice. The ideas and strategies should never be used without first assessing your own personal and financial situation, or without consulting a financial professional.
The author does not have a position in mentioned securities at the time of publication. Any opinions expressed herein are solely those of the author, and do not in any way represent the views or opinions of any other person or entity.
My regular blog is the RRG Chartsblog. If you would like to receive a notification when a new article is published there, simply “Subscribe” with your email address.