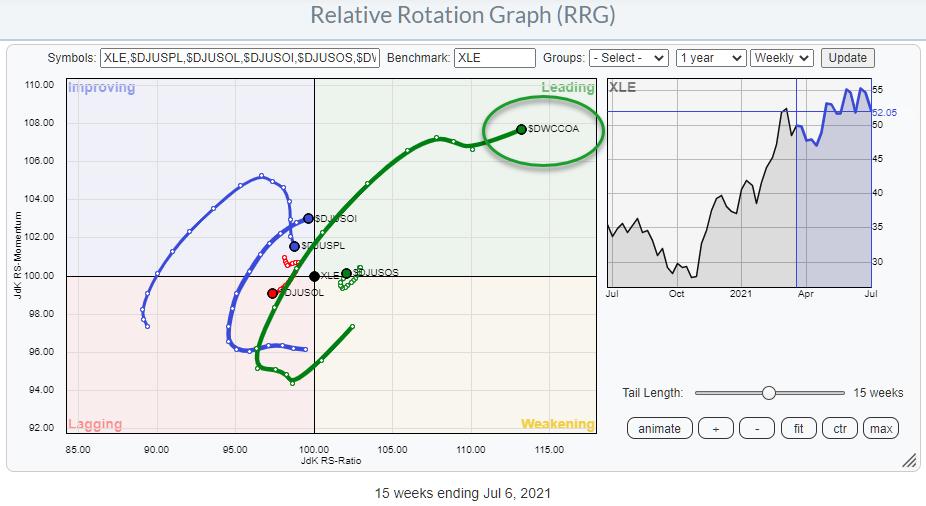
This Relative Rotation Graph shows the industries that make up the Energy sector. One tail that especially stands out is for $DWCCOA. I have looked at this RRG, and the sector before but always excluded Coal as none of the stocks in that index are in the S&P.
Today I want to see if I can find one or more interesting stocks in that Coal group.
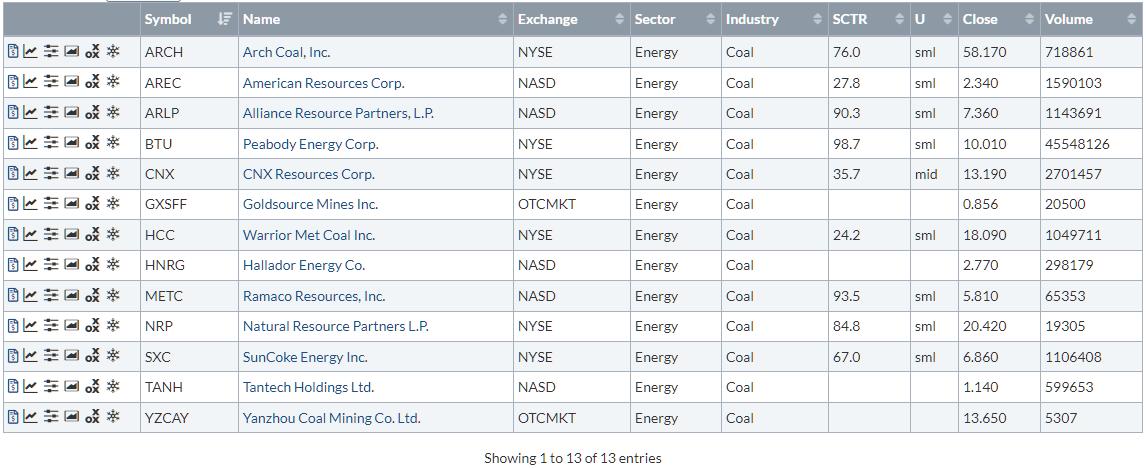
Using the scan engine to find the constituents of this group gives me the following names:
When I throw this group onto an RRG and use $SPX as the benchmark, you will see a bias towards the leading quadrant, as can be expected because of the group’s strength.
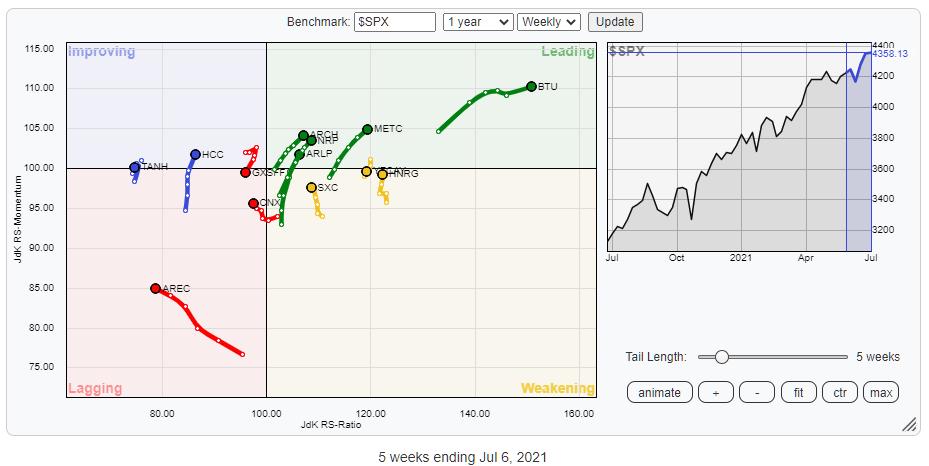
The tails inside the leading quadrant are all moving at a positive RRG-Heading. While going over their price charts, BTU and METC looked interesting to me.
BTU – Peabody Energy
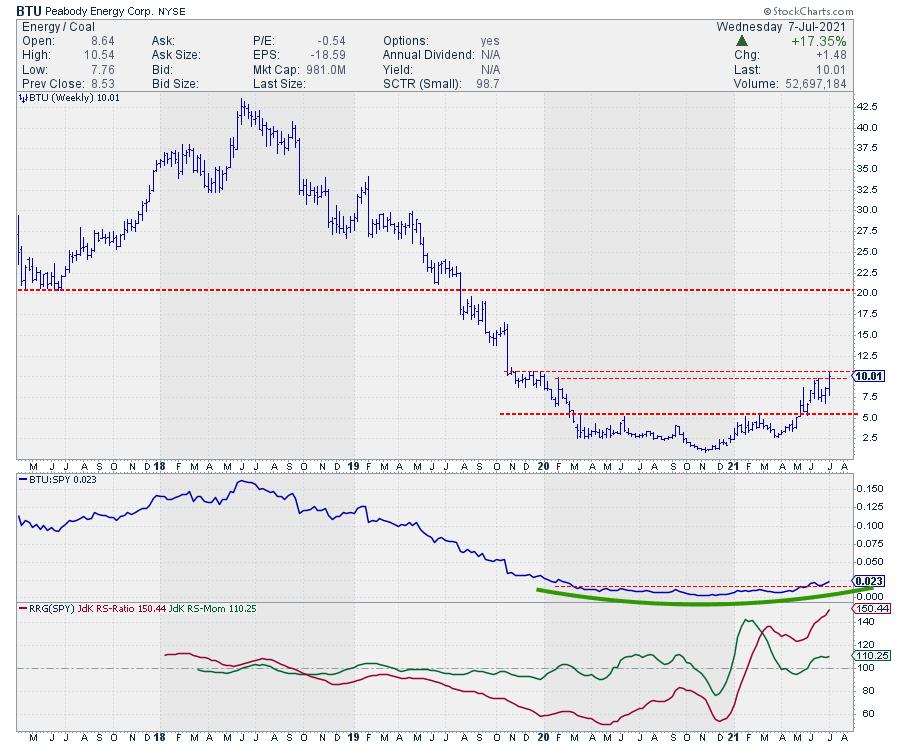
Both the price and the relative charts are showing a long rounding bottom.
Price broke above its horizontal resistance a little earlier than relative strength. Still, the RRG-Lines had picked up a turnaround and move into the leading quadrant already back in February.
At the moment, the price is about to break the next horizontal boundary. So when that area around $10 is cleared, it looks like upside is available towards $20.
METC – Ramaco Resources
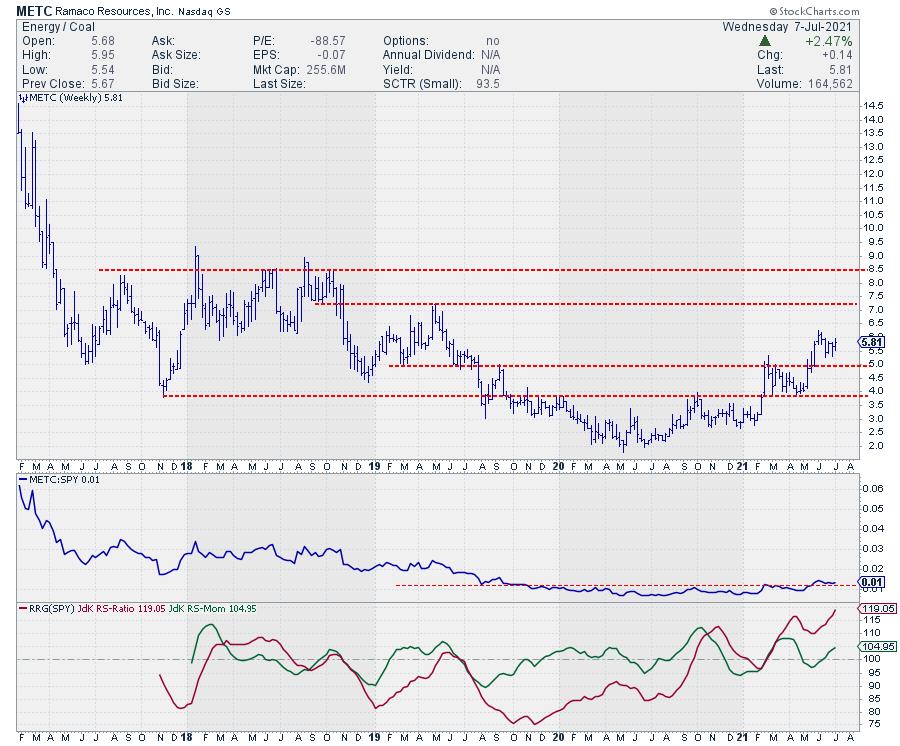
Ramaco Resources has less historical data but looks to be in the same boat. A long-term turnaround in price and relative strength and a push into the leading quadrant around the same time as BTC.
All in all, also for METC, the odds seem to favor a further rally.
BTU seems to be the better choice based on the upside potential towards the first serious resistance level in percentage terms.
$StaySafe, –Julius