We are now in the seasonally weakest half of the year, which is why “sell in May and go away” comments have made the annual rounds. While the Sell in May approach has not been particularly successful in recent years, it is indeed based on the general tendency of the market to settle down as it nears the summer months.
What will May bring in 2022? So far, it’s been about extreme volatility, sudden price swings and elevated uncertainty for investors. And while the market rallied nicely going into the end of this week, the long-term trend remains decidedly down for the major averages.
With the S&P 500 having reached around a 20% drop from the January highs, many investors are looking for signs of a bottom. But a review of one key breadth indicator suggests that the pain may just be beginning.
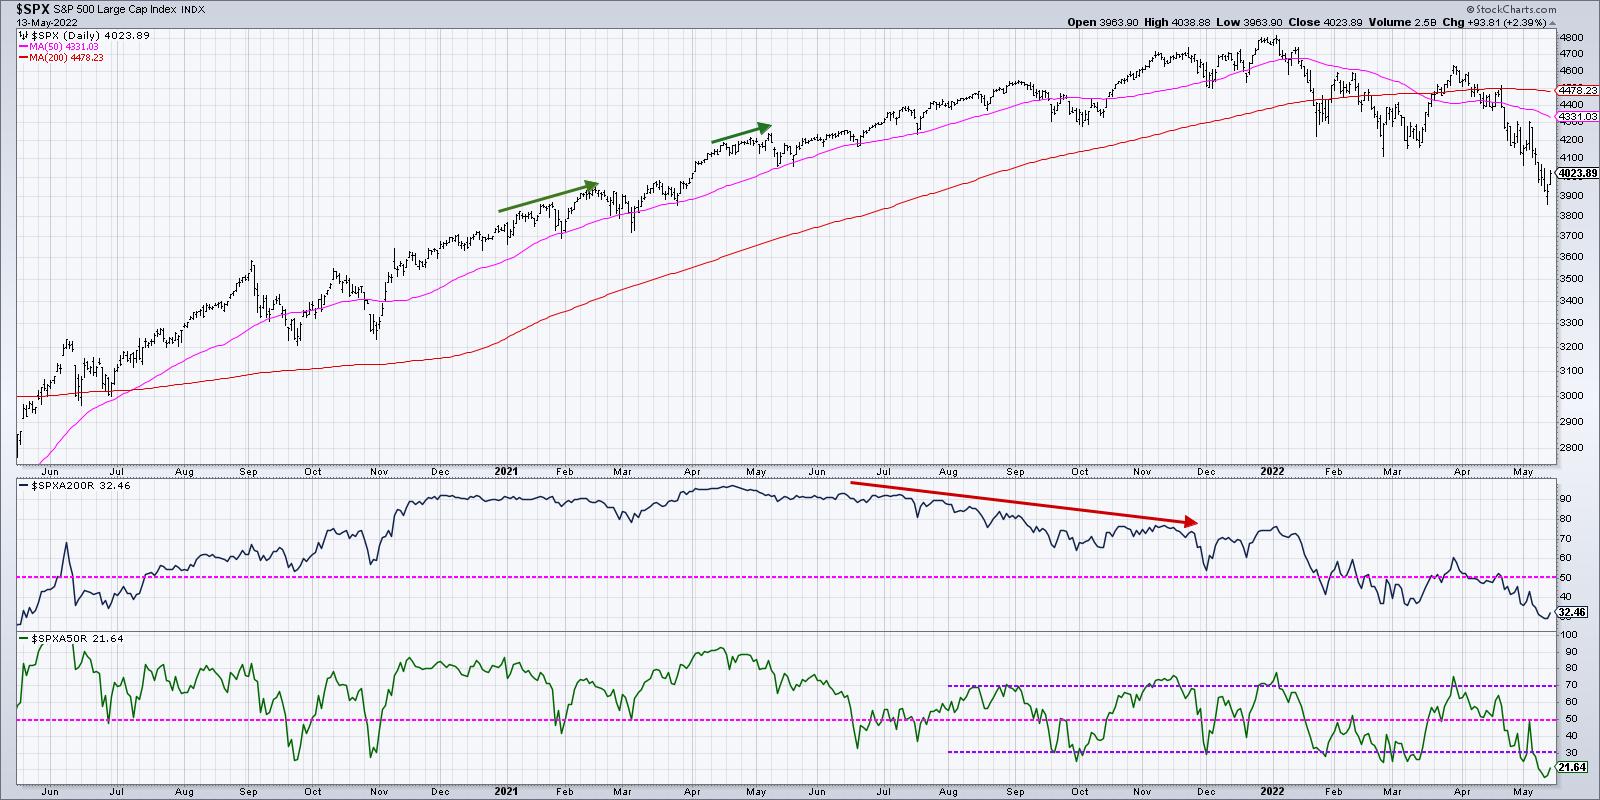
The S&P 500 broke down through its 50-day moving average in early April, soon to be followed be the 200-day moving average as well. But, as of Friday’s close, one out of every three S&P 500 members actually sits above its own 200-day moving average.
We also see that 22% of S&P 500 stocks sit above their own 50-day moving average, which means that, while many stocks are in a similar pattern to the broader indexes, a decent number of names are still holding up on a price basis.
Over the last 22 years, I’ve enjoyed working with and learning from some of the most successful investors in the world.
While I have found that there are a number of ways to make a profit in the financial markets, there are certain consistent habits demonstrated by top investors.
In our upcoming FREE webcast, Seven Habits of Successful Investors, I’ll share my own journey as an investor and how I’ve tried to incorporate the best practices I’ve seen firsthand from top money managers and traders.
Please join me on Tuesday, May 17th at 1:00pm ET for this FREE webinar. You can sign up HERE and I’ll follow up with additional details before the event.
So how does this compare to previous market cycles? Looking at recent history, we can see that, since August 2021, a break below the 30% level in the bottom panel meant a buyable bounce. We’ve seen four such bounces over the last nine months.
So, having pushed below 20% this week, does that mean a rally from here is a certainty? Well, a short-term bounce could certainly make sense given the bombed-out breadth numbers. But how bombed-out are they, really, relative to previous extreme readings?
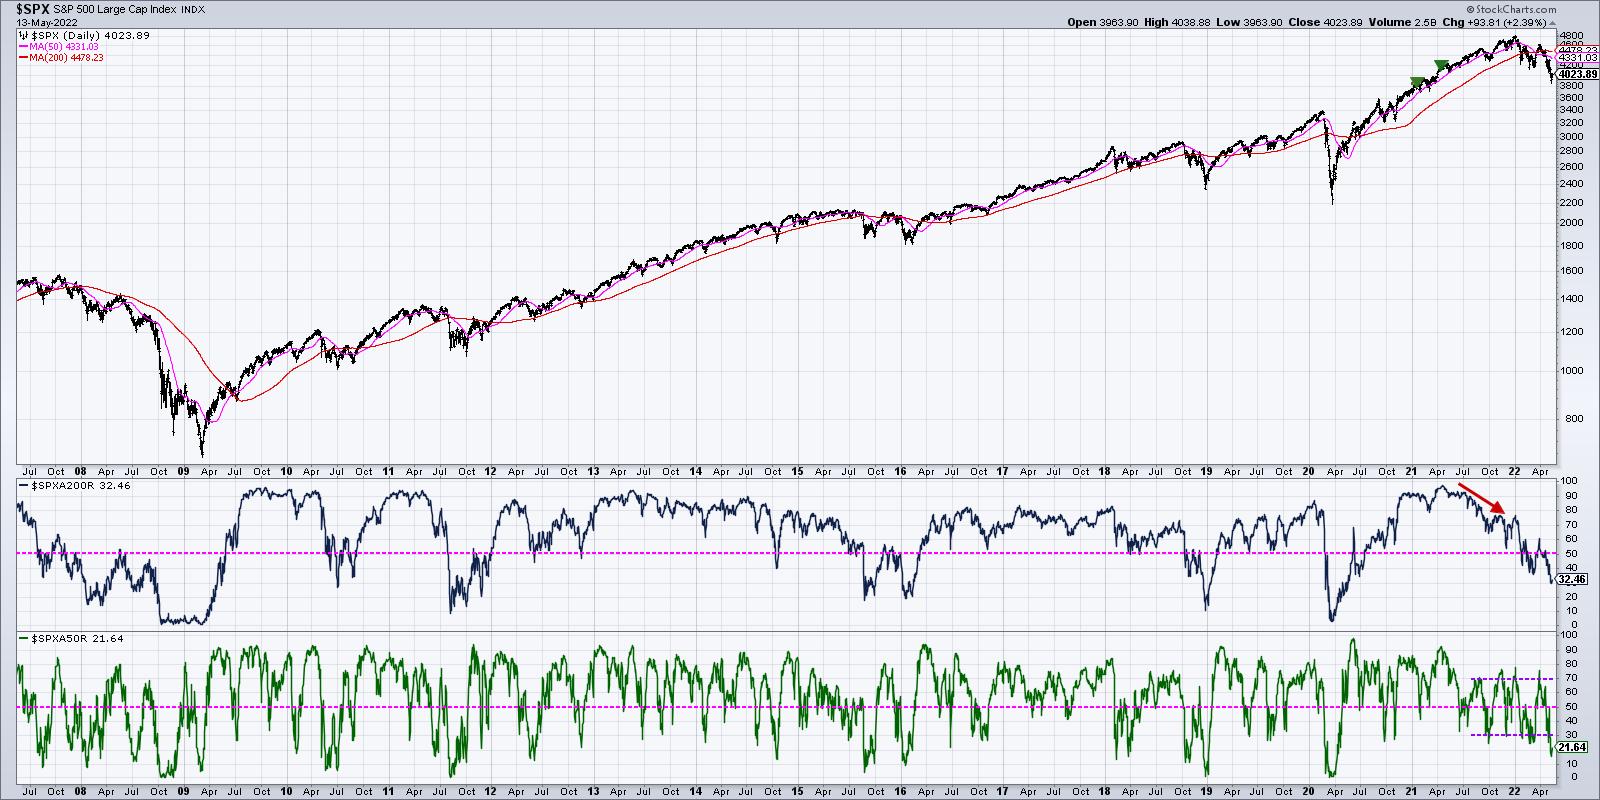
When we go back to the 2009 market low, we see that, for both of these breadth indicators, the recent low readings still do not come close the breadth conditions for most of the corrective market phases. In March 2020, the percent above the 200-day got down to single digits, and the percent above the 50-day reached all the way down to zero. We see similar readings in 2018 and 2011.
But look at the 2007-2009 period and you’ll see why this indicator has not reached anywhere near dire readings by historical standards. In that case, we saw the percent of stocks above the 200-day remain in single digits for almost six months!
So is breadth showing negative readings relative to the last 12 months? Absolutely. But have we seen levels similar to what we’ve seen at previous correction lows? Not yet.
We may certainly see a tradable bounce as the Sell in May phenomenon takes another breather. But until the breadth picture becomes more negative on selloffs, a capitulation phase may be a bit further down the road.
RR#6,
Dave
P.S. Ready to upgrade your investment process? Check out my YouTube channel!
David Keller, CMT
Chief Market Strategist
StockCharts.com
Disclaimer: This blog is for educational purposes only and should not be construed as financial advice. The ideas and strategies should never be used without first assessing your own personal and financial situation, or without consulting a financial professional.
The author does not have a position in mentioned securities at the time of publication. Any opinions expressed herein are solely those of the author, and do not in any way represent the views or opinions of any other person or entity.