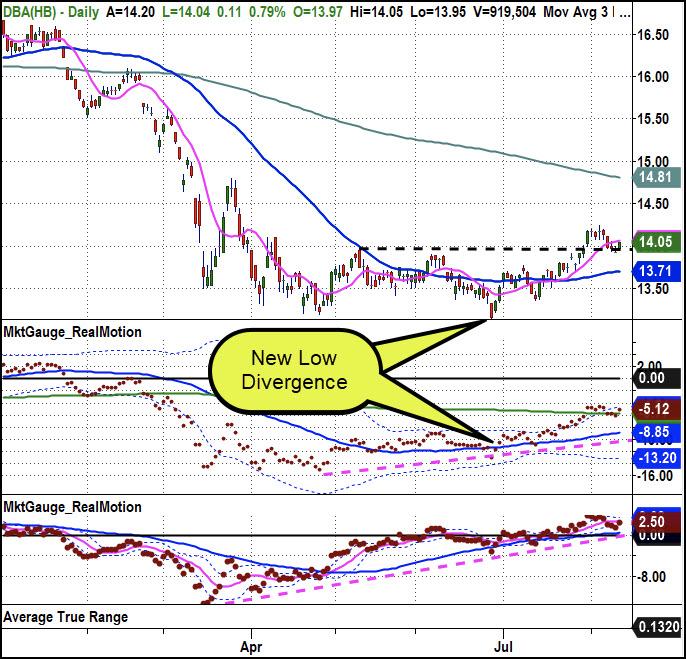
Today’s chart is one that every investor should keep an eye on (but most will not), as that double bottom base breakout pattern is in a market that has been declining for almost a decade! However, there’s good reason to believe it could wake up like gold has in the last few years, because…
It’s a logical place for money to rotate into. Also, as I’ll explain later, the double bottom you see is part of a very bullish multi-timeframe divergence, and…
If it explodes higher, your wallet is going to feel it.
Plus, that double bottom had the same type of bullish pattern we just experienced in the QQQ today (potentially). And since you could be wondering how I can be calling the QQQs bullish today after my commentary yesterday, let’s start there.
Market rotation has been a theme here, and today was a good example of how the process ebbs and flows. Today, both the QQQ and IWM gapped higher but, after the open, they took different paths.
The QQQ, which has been pulling back for a few days, continued to move higher. In contrast, the IWM, which was on a tear prior to yesterday, spend the day drifting lower. IWM’s move lower wasn’t very bearish; it didn’t even break below yesterday’s low. On the other hand, the QQQ’s rally was explosive and led higher by leaders like SMH and APPL.
Yesterday, I highlighted the QQQ breaking below its 10-DMA and warned that further weakness could continue. Today’s a very different story…
The strength in the QQQ demonstrates why it’s important to look for confirmation (or a continuation) when a market breaks an inflection point like the 10-DMA. Additionally, when an inflection point is broken and the the market immediately reverses, it’s usually a sign of a turning point.
This is exactly what happened today in the QQQ and at the low in the chart above. So what should we do next? Watch to see if the QQQ continues higher as it would complete a bullish reversal pattern.
The chart, as you can see below, is DBA, which is the Agricultural Commodities ETF. So, if this explodes higher, it will mean food prices are headed higher. It would also represent more signs of inflation, which would be bearish for bonds.
The moving averages are the 10-, 50- and 200-day MAs.

The indicators below the chart are MarketGauge’s proprietary momentum indicators, called Real Motion (which will soon be available on the StockCharts platform). The pattern of a breakout over a base that flags back to the breakout level and then heads higher is very bullish. Plus, when Real Motion indicators diverge at major market bottoms as they have here, that indicates that the momentum had turned up even before price turned bullish. As a result, I expect the next up move to be substantial.
Finally, as this relates to the pattern in the QQQ today…
Notice how DBA’s low day was a one day break to new lows that did not continue. In fact, it immediately reversed and closed higher than the prior day’s high as the QQQ did today. Then it continued higher. Additionally, the current flag broke the 10 DMA and has not continued lower. Now, a continuation of a move over the 10-DMA should be all this needs to begin its next move higher.
Best wishes for your trading,
Geoff Bysshe
President, MarketGauge.com
(Geoff is filling for Mish until August 31st)
- S&P 500 (SPY): Be cautious under 332. Watch 330 as important support
- Russell 2000 (IWM): Consolidation day. 160 resistance area and 153 key support.
- Dow (DIA): Consolidation day. 270 now pivotal support
- Nasdaq (QQQ): Closed over prior day high and back over 10 DMA. 275 is the all-time high. 260 is key support level and a trendline
- TLT (iShares 20+ Year Treasuries): Traded lower again. Stopped and now sits on the 50-DMA support